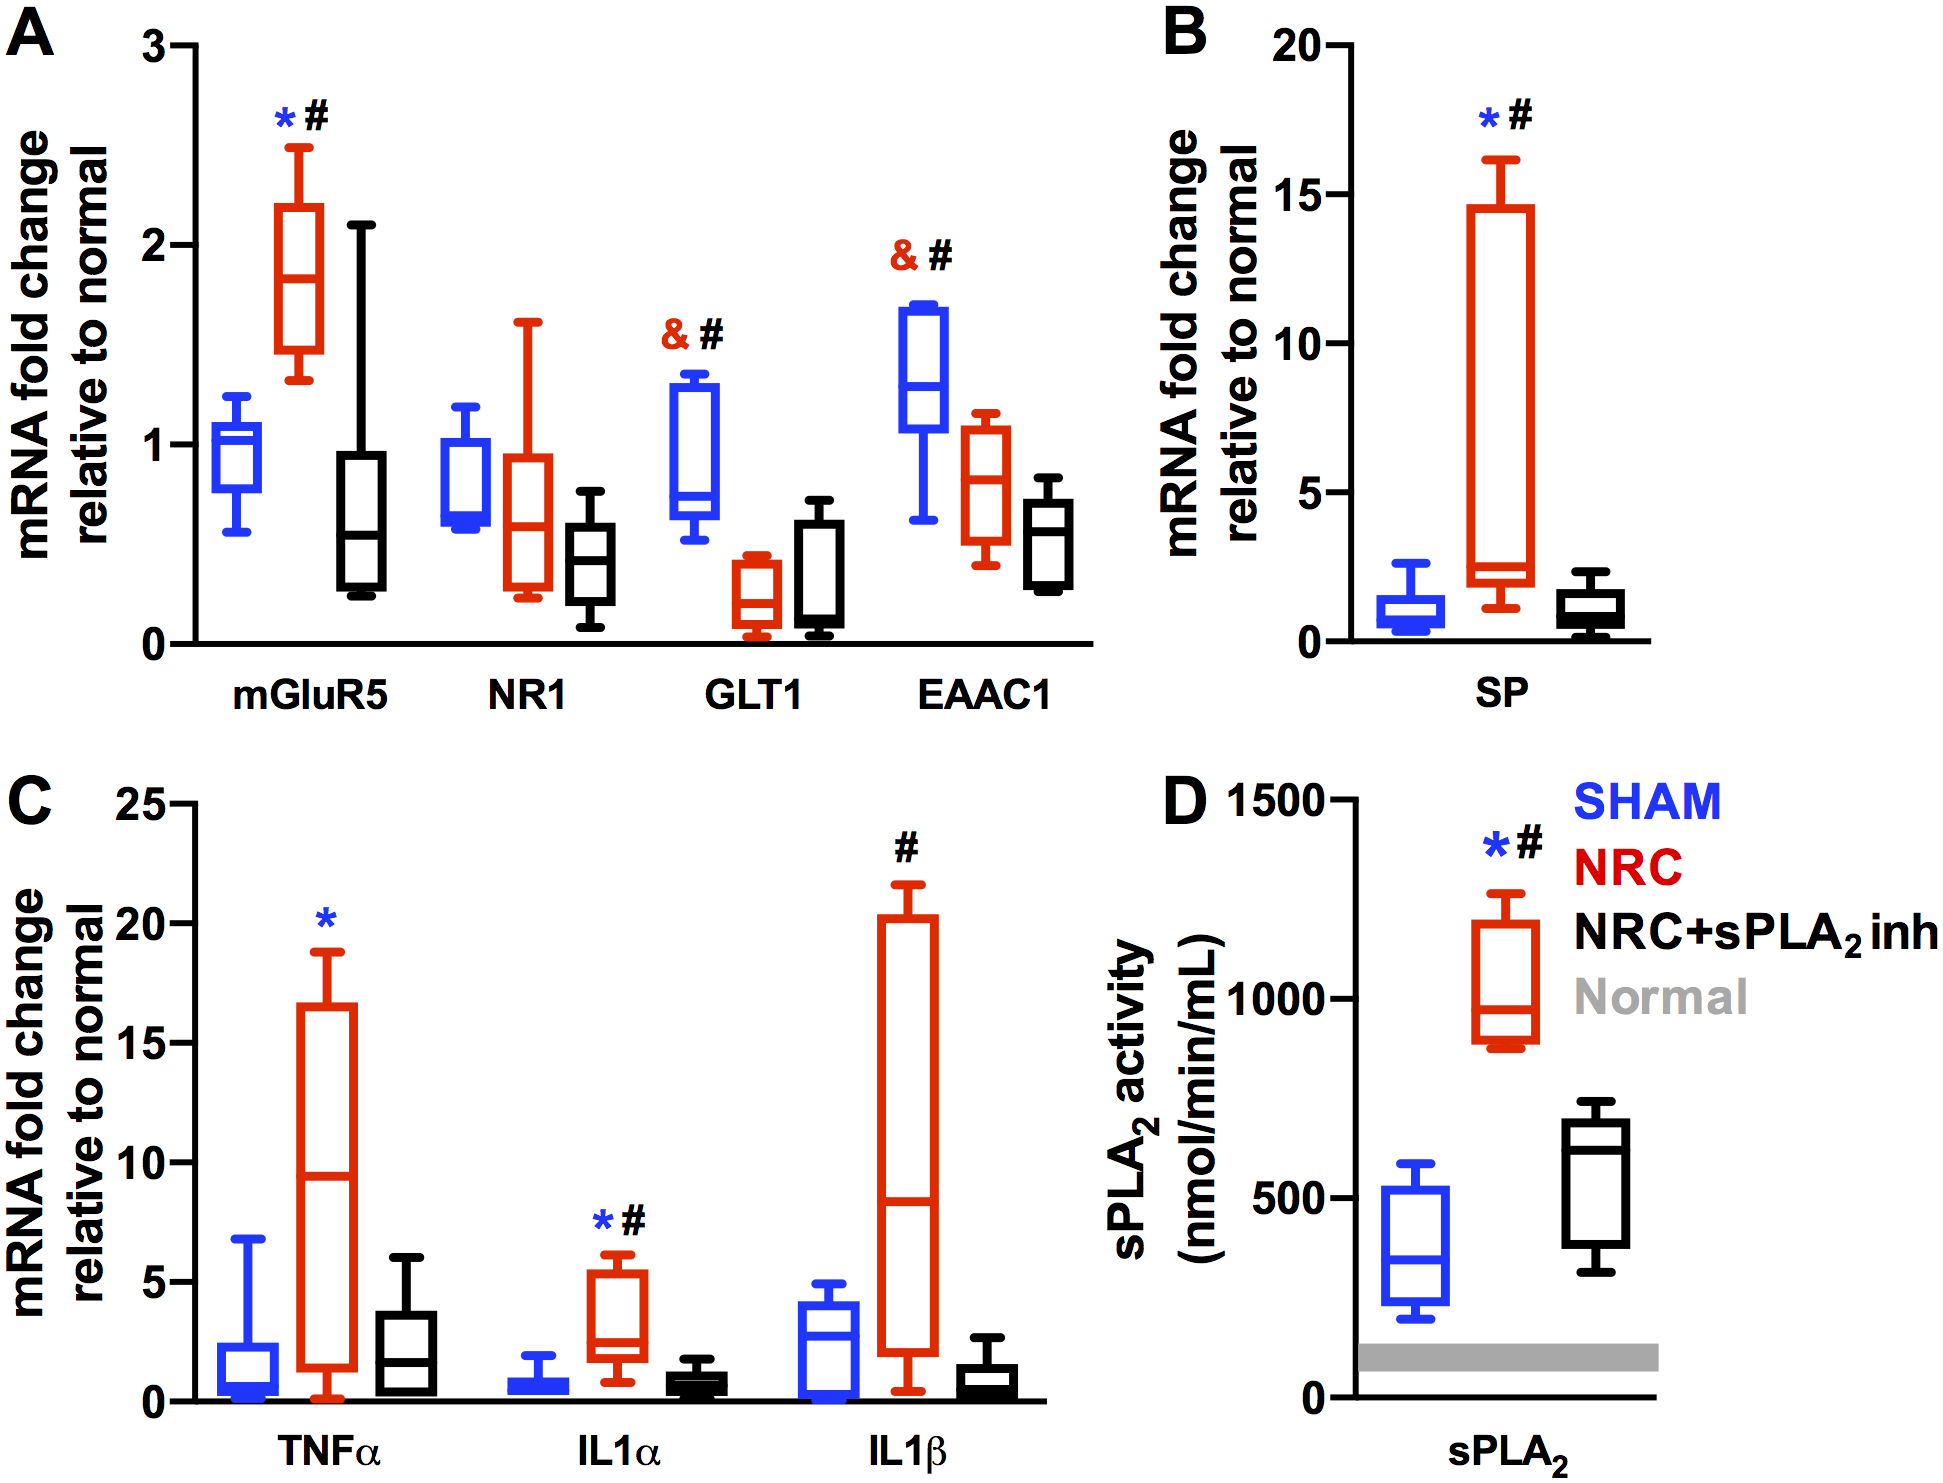
Fig. 4. Assays of mRNA and sPLA2 activity in C6 ipsilateral spinal cord tissue.

(A) mGluR5 mRNA is elevated after NRC relative to sham (*p<0.03), and treatment with sPLA2 inhibitor (NRC+sPLA2 inh) prevents this increase (**p<0.01). NR1 mRNA levels are not different in any group. Both GLT1 and EAAC1 mRNA levels are reduced after NRC relative to sham (***p<0.04). Inhibitor treatment does not prevent this decrease as NRC+sPLA2 inh mRNA levels are lower than sham (**p<0.01) and not different from NRC for both GLT1 and EAAC1. (B) Substance P (SP) mRNA is elevated after NRC relative to both sham (*p<0.05) and NRC+sPLA2 inh (**p<0.05). (C) TNFα mRNA is elevated after NRC relative to sham (*p<0.02). IL1α mRNA is elevated after NRC relative to both sham (*p<0.01) and NRC+sPLA2 inh (**p<0.02). IL1β mRNA is elevated after NRC relative to NRC+sPLA2 inh (**p<0.03), but not sham. (D) Spinal sPLA2 activity is significantly elevated after NRC relative to sham (*p<0.0004) and treatment with sPLA2 inhibitor (NRC+sPLA2 inh) prevents this increase (**p<0.003). sPLA2 activity levels in sham and NRC+sPLA2 inh are not different. Grey bar represents sPLA2 activity in normal tissue.
