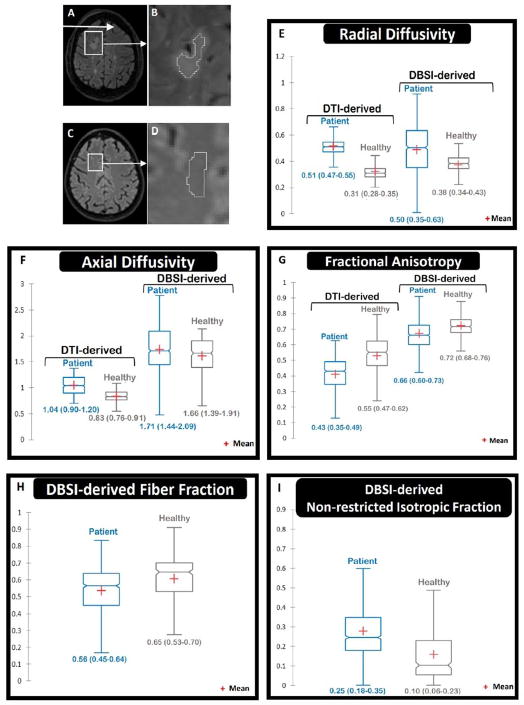
Figure 1.
A & B FLAIR image shows the region of interest (ROI) in the biopsied lesion (excluding the actual biopsy site, and separated by a two-voxel layer to avoid possible artifacts). Other disseminated white matter hyperintensities are seen in the FLAIR image, too. C & D. A comparable ROI in the right frontal white matter of a healthy control was identified. In panels E to I, the central horizontal line in each box plot shows medians. The vertical thickness of each box represents the interquartile range (IQR). Numbers below each box show median (1st quartile – 3rd quartile). Notches show the 95% confidence intervals (CI) around medians (non-overlapping CIs represent statistical significance). The lower and upper whiskers show the lowest and highest values within 1.5 IQR of the lower and higher quartiles, respectively. E. Both DTI-derived and DBSI-derived radial diffusivity (RD) were increased in the lesion compared to the healthy control (consistent with demyelination). F. DTI-derived axial diffusivity (AD) was increased in the lesion (confounded by isotropic fraction such as edema); whereas DBSI-derived AD was similar to the healthy control (consistent with preserved integrity of residual axons). G. Both DTI-derived and DBSI-derived fractional anisotropy were decreased (consistent with impaired white matter integrity). H. DBSI-derived fiber fraction was modestly decreased in the lesion compared to the healthy control (consistent with relatively reduced axonal content). I. DBSI non-restricted isotropic fraction was elevated in the lesion (consistent with edema).

