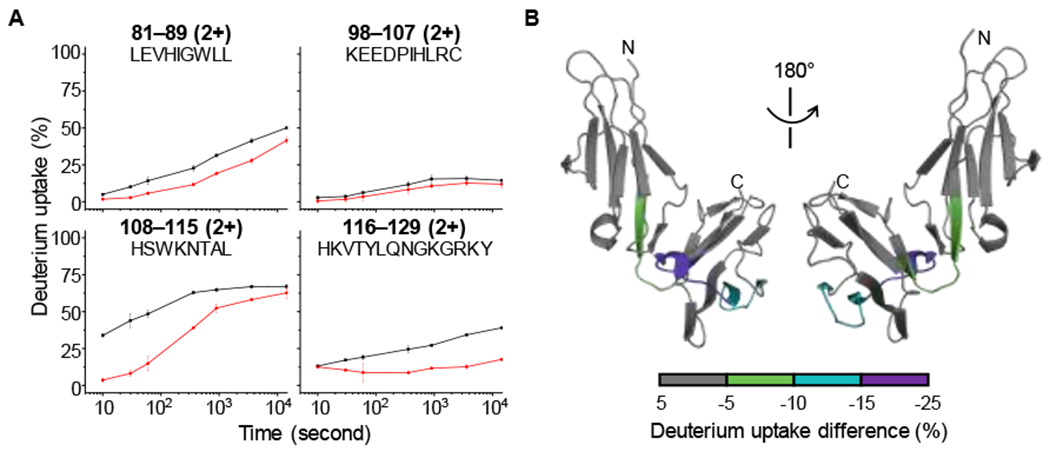
Figure 2.

(A) HDX kinetic plots of representative peptides of FcγRIII in the unbound (black) and bound (red) states. The peptide, its charge state, and its amino acid sequence are labeled on each panel. (B) Differential deuterium uptake percentage of FcγRIII mapped onto the crystal structure. The color scale representing the difference between bound and unbound is shown in the bottom of the panel. Mirrored views are provided for clarity.
