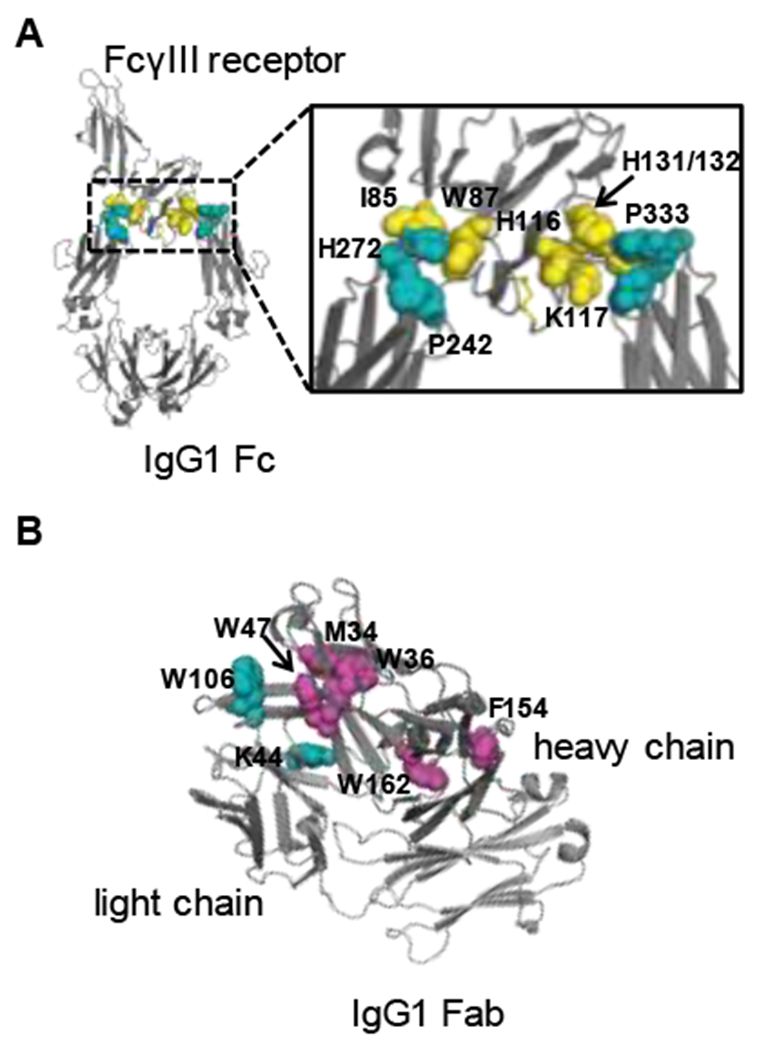
Figure 5.

(A) Critical binding residues of FcγIII receptor and IgG1 identified by FPOP mapped on the crystal structure of FcγIII receptor/IgG1 Fc complex (PDB: 1E4K). The critical residues in FcγIII receptor are shown in yellow, and the critical residues in IgG1 Fc are shown in cyan. (B) Critical residues of IgG1 identified by FPOP mapped on the crystal structure of IgG1/Fab (PDB: 4KAQ). The residues that display protection in FPOP are shown in cyan, and magenta is used to represent the residues that display exposure in FPOP.
