
Figure 1. H6PDH mRNA and protein expression in adipose and other tissues of H6PDHAcKO and control mice.
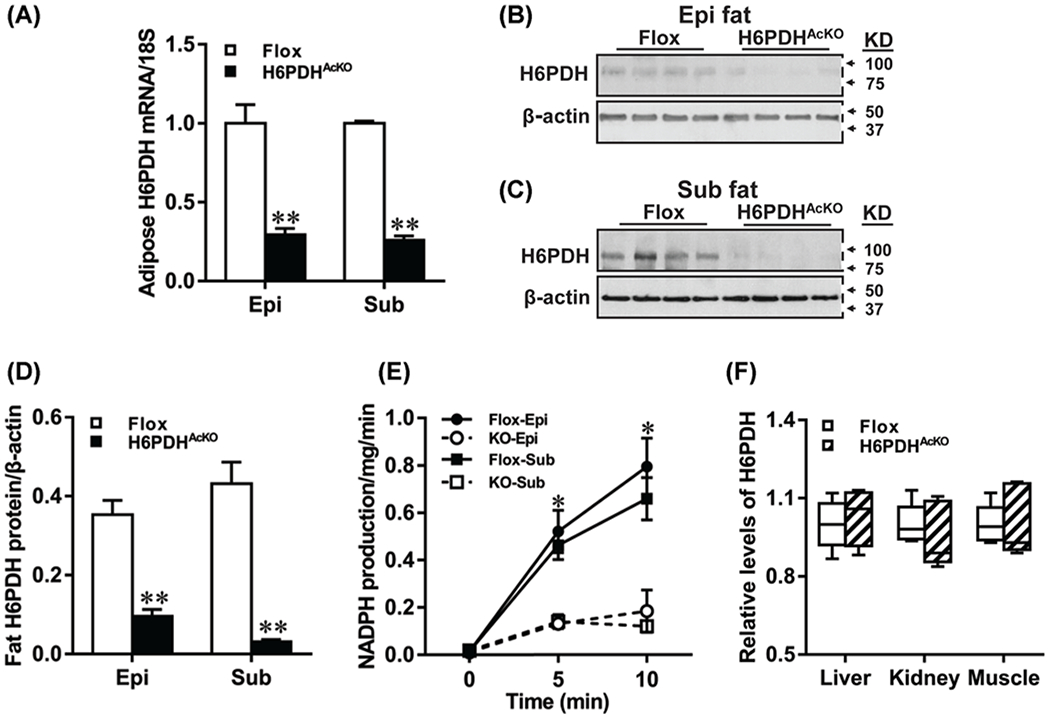
(A) Quantitative real-time PCR analysis exhibiting the mRNA expression of H6PDH in epididymal (Epi) and subcutaneous (Sub) fat of H6PDHAcKO mice and flox controls were normalized to 18S. (B–D) Western blotting images for H6PDH in Epi fat (B) and Sub fat (C) of the two genotypes and the quantification was relative to the amount of β-actin with NIH ImageJ (D). (E) H6PDH activity was measured in the adipose tissues using 2 mM G6P as substrate with the presence of NADP. (F) mRNA expression in liver, kidney and muscle of H6PDHAcKO mice and control littermates. Data are means ± SE of eight mice/group. *P<0.05 and **P<0.01 vs. Flox control mice.