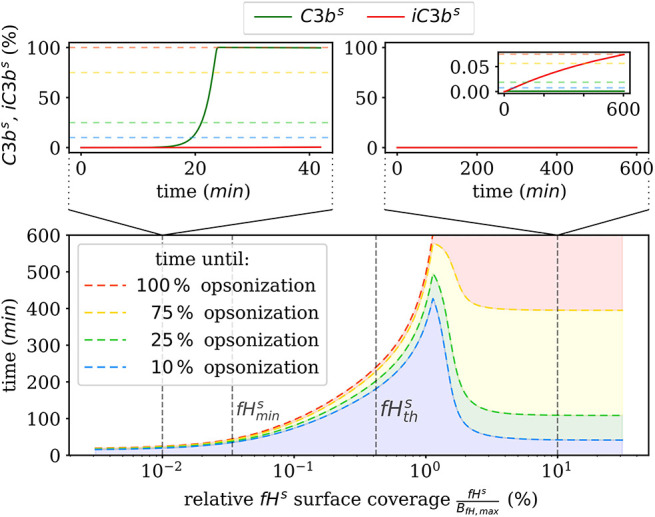
Figure 3.

Summary of the numerical integration of 1,000 simulations for varied fHs concentrations. The time intervals indicate how much time passes until a certain amount of C3bs is attached to the cell surface. Two typical molecular concentration dynamics are shown for small fHs concentrations (top left) and high fHs concentrations (top right).
