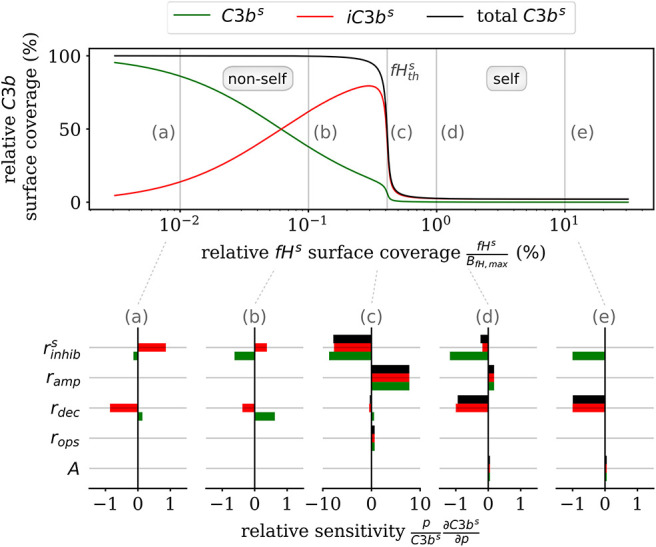
Figure 5.

Sensitivity analysis of the model parameters for the steady state of surface-bound C3b molecules. The upper plot shows the relative concentration of complement molecules on the cell surface. The lower plots for selected Factor H concentrations give the relative local sensitivity of the complement molecules with respect to a parameter p that is individually varied. Positive sensitivities correlate with increasing molecule concentration. The non-self regime is sensitive to the rates rdec and (see a,b). The transition region (c) is dominated by and ramp and the self-regime is dominated by the parameters A, rdec, , and ramp (see d,e).
