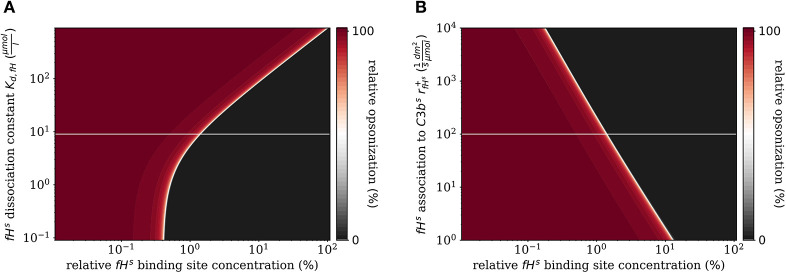
Figure 7.
Relative opsonization in the steady state for varied system parameters as a function of the relative Factor H binding site concentration. The white line indicates the DynaCoSys model for standard parameter values. (A) Variation of the dissociation constant for Factor H and binding sites on the cell surface. (B) Variation of the reaction rate for fHs binding to C3bs molecules.

