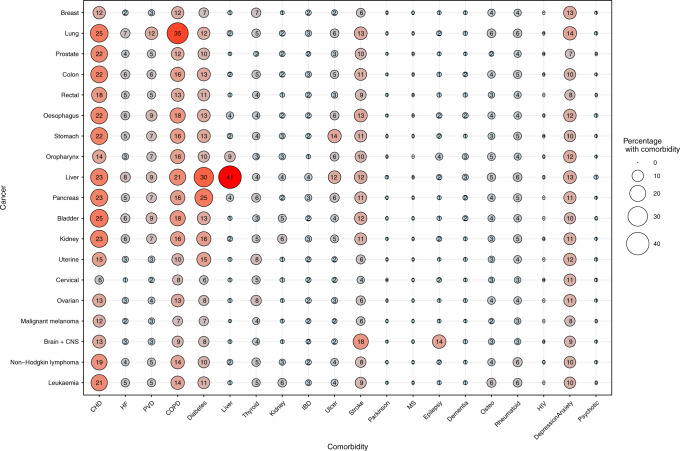
Fig. 2. Bubble plot of the percentage of comorbidities by cancer type among 261,745 patients diagnosed in the period 2005–2015, Denmark.
CI confidence interval, CHD coronary heart disease, HF heart failure, PVD peripheral vascular disease, COPD chronic obstructive pulmonary disease, Diabetes types 1 and 2, Liver liver disease, Thyroid thyroid disorders, Kidney kidney disease, IBD inflammatory bowel disease, ulcer gastric, duodenal and peptic, stroke hemiplegia, Parkinson Parkinson disease, MS multiple sclerosis, Dementia Alzheimer, vascular, Osteo osteoporosis, Rheumatoid rheumatoid arthritis, Psychotic psychotic diseases.

