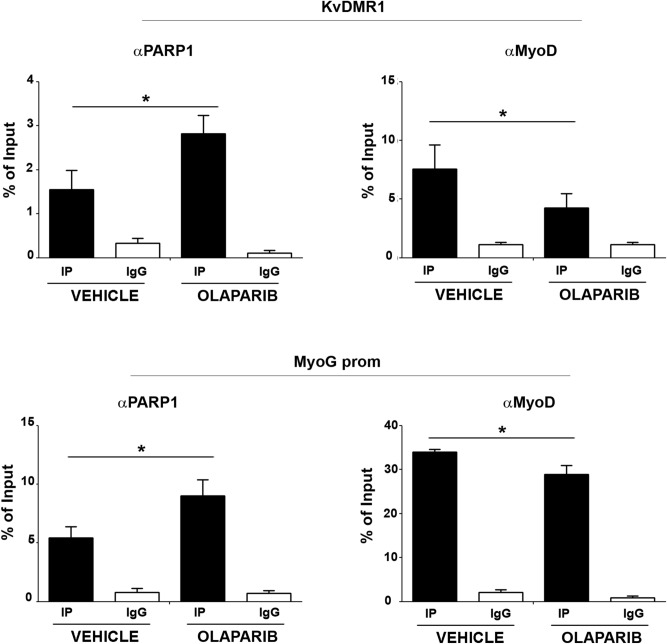
Figure 7.
Olaparib treatment results in increased PARP1 binding and decreased MyoD recruitment to p57 and myogenin regulatory regions. ChIP-qPCR analysis for PARP1 and MyoD binding to KvDMR1 and myogenin promoter (MyoG prom). Samples were prepared from C2.7 cells collected 24 h after the shift to differentiation medium in the presence of either 1 µM Olaparib or the control vehicle DMSO (VEHICLE), and then immunoprecipitated as described in Fig. 4. Protein binding is expressed as percentage of input and represents the mean ± SEM of three independent experiments. Statistical significance: p-value < 0.05 (*).

