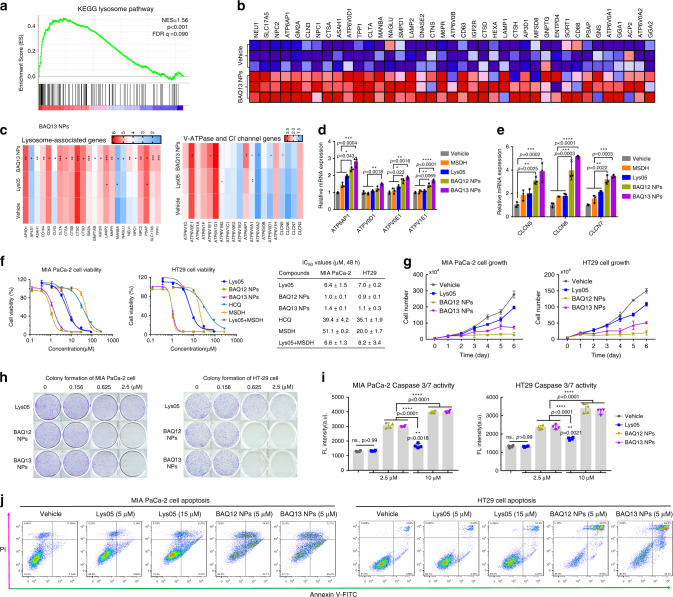
Fig. 4. BAQ ONNs altered the expression of lysosomal genes and caused cell death via apoptosis.
a GSEA demonstrating the enrichment of lysosomal gene sets in MIA PaCa-2 cells treated with BAQ13 NPs (5 µM, 24 h). GSEA was performed with n = 1000 permutations, where p adjust < 0.05 and FDR < 0.05 were considered significant. b Representative upregulated lysosomal genes from a. c Comparison of gene upregulation between Lys05 and BAQ13 NPs. d, e qPCR analysis of V-ATPase genes (d) and Cl− channel genes (e) involved in the indicated treatments (5 μM, 24 h); data are mean values ± SD; n = 3. f Viability curves of cells that were exposed to the 48 h treatments and the corresponding IC50 values; data are mean values ± SD; n = 3. g MIA PaCa-2 (1.5 µM) and HT29 (1.0 µM) cell growth curves within continuous treatments; data are mean values ± SD; n = 3 independent experiments. h Clonogenic assay of MIA PaCa-2 and HT29 cells; n = 3. i Caspase 3/7 activity in MIA PaCa-2 and HT29 cells that were treated for 6 and 12 h, respectively; Data are mean values ± SD; n = 4. j Percentage of apoptotic population of MIA PaCa-2 (left) and HT29 (right) cells that were treated for 24 h. All the statistical p values were calculated by one-way ANOVA with the Tukey’s multiple comparison test; ns not significant; *p < 0.05; **p < 0.01; ***p < 0.001; ****p < 0.0001.

