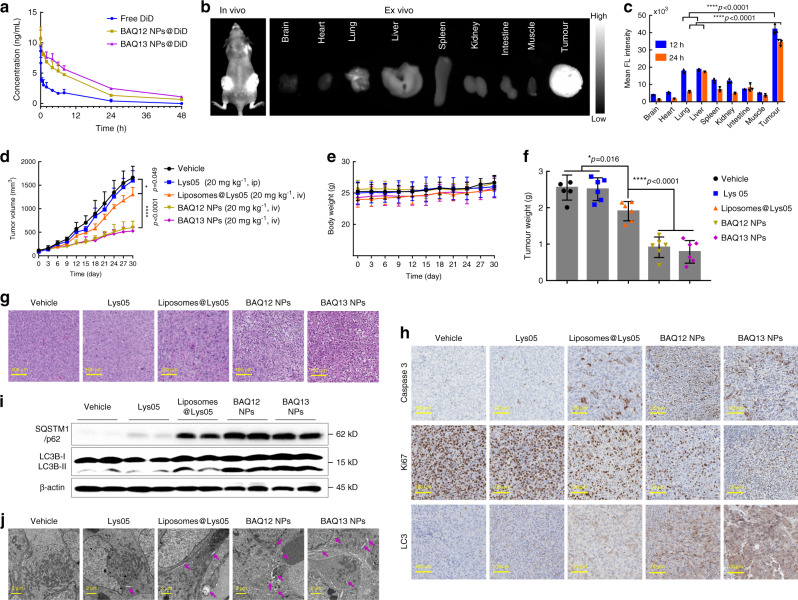
Fig. 5. The pharmacokinetics, biodistribution and in vivo antitumour effect of BAQ ONNs.
a The plasma concentration-time profiles of DiD-loaded BAQ ONNs and free DiD after intravenous injection; data are mean values ± SD; n = 3. b In vivo and ex vivo biodistribution of BAQ13 NPs in mice bearing HT29 tumours at 24 h post injection. c Quantitative fluorescence intensity of tissues obtained at 12 and 24 h post injection; data are mean values ± SD; n = 3. d MIA PaCa-2 tumour growth curves in mice that were treated as indicated every 3 days; data are mean values ± SD; n = 6 tumours per group. e Body weight of mice during the treatment; data are mean values ± SD; n = 6 mice per group. f Weight of harvested tumours at the end of the treatment; data are mean values ± SD; n = 6 tumours per group. g–j Representative H&E (g), IHC (h), immunoblotting (i) and TEM (j) results of tumours that were harvested at the end of treatments; Blots in i were from three individual tumours of each group; purple arrows in j: autophagic vesicles; experiments in g–j were all repeated three times independently. All statistical p values were calculated by one-way ANOVA with the Tukey’s multiple comparison test; *p < 0.05; ****p < 0.0001.

