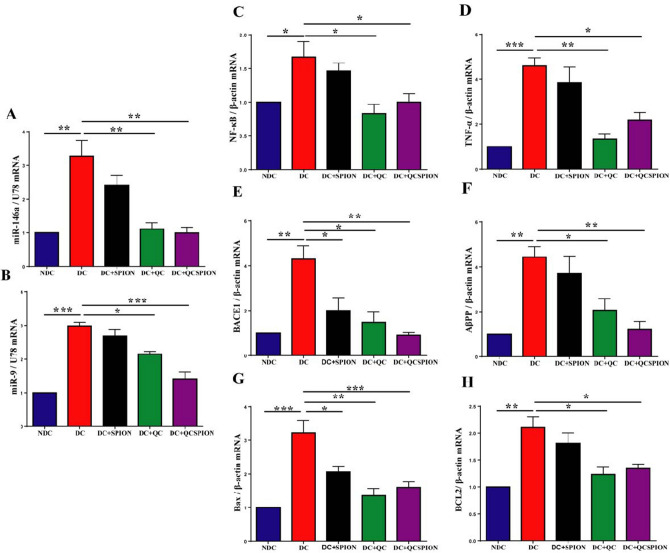
Figure 2.
The graph of relative expression of (A) miR-146a, (B) miR-9 (C) NF-κB, (D) TNF-α, (E) BACE1 (F) AβPP (G) Bax, and (H) Bcl-2 in the hippocampus of experimental groups. NDC: non-diabetic control, DC: diabetic control, DC + SPION: diabetic treated with superparamagnetic iron oxide nanoparticle, DC + QC: diabetic treated with quercetin, DC + QCSPION: diabetic treated with quercetin-conjugated superparamagnetic iron oxide nanoparticle. * P < 0.05, ** P < 0.01 and *** P < 0.001 and P < 0.0001 versus diabetic control group (one-way ANOVA, Tukey’s multiple comparison tests). The expression levels are investigated by quantitative real-time PCR and ΔΔCt method. Data expressed as mean ± S.E.M.

