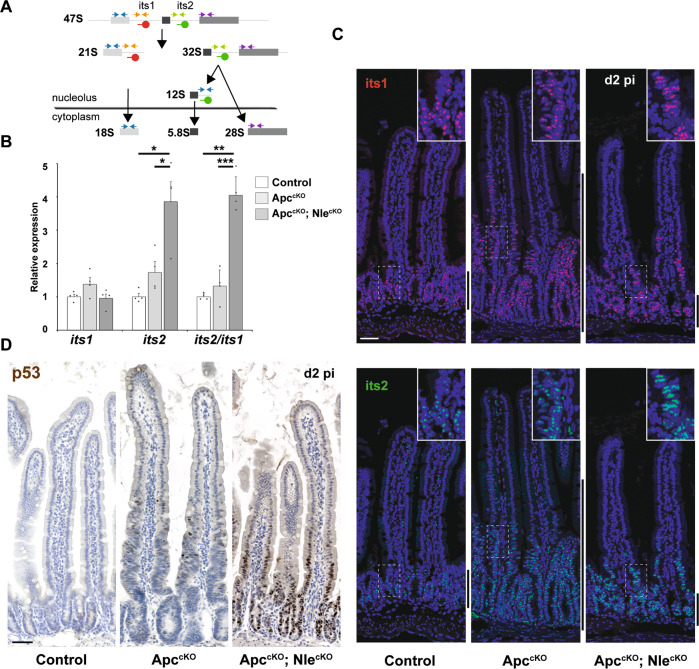
Fig. 4. Nle loss-of-function leads to ribosome biogenesis defects and p53 stabilization in the Apc-deficient epithelium.
a Simplified diagram illustrating the main steps of ribosome biogenesis in eukaryotic cells. Blue arrows represent the primers used to measure the levels of ribosomal RNAs by RT-qPCR. FISH probes used to detect its1 (red) and its2 (green) sequences from precursors of the small and large ribosomal subunits, respectively, are indicated. b RT-qPCR performed on total RNA from Control, ApccKO and ApccKO; NlecKO intestinal crypt extracts at day 2 pi. Graphs represent the mean fold changes ± S.E.M. for the different amplicons. n = 4 for each genotype. *p < 0.05; **p < 0.01; ***p < 0.001 according to Student’s t test. c FISH for its1 (red) or its2 (green) counterstained with Hoechst (blue) on intestinal epithelium sections from Control, ApccKO and ApccKO; NlecKO intestines at day 2 pi. Scale bars, 50 μm. Lateral bars indicate the position of the crypt domain for Control and ApccKO; NlecKO and of the enlarged crypt-like compartment for ApccKO. d p53 immunostaining (brown) counterstained with Hematoxylin (blue) on intestinal epithelium sections from Control, ApccKO and ApccKO; NlecKO intestines at day 2 pi. Scale bars, 50 μm.

