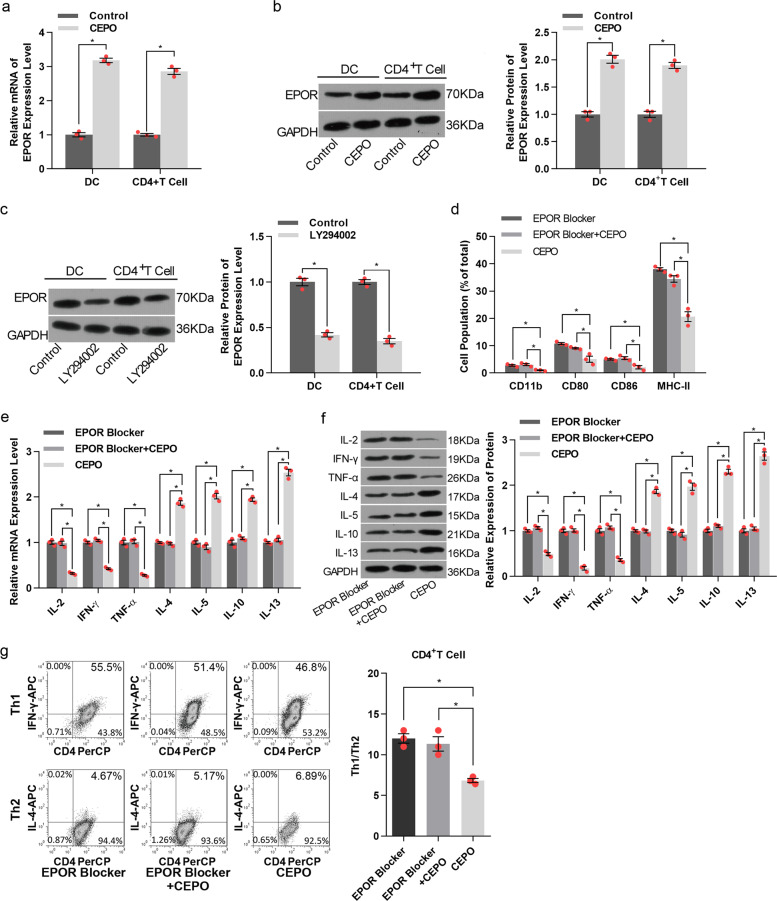
Fig. 4.
Analysis of EPO receptor (R) levels and the influence of EPOR blocker on DC and T cells. a Effect of CEOP on EPOR mRNA levels in DC and CD4+ T cells was examined by qPCR analysis. b Effect of CEOP on EPOR protein levels in DC and CD4+ T cells was detected by western blotting. c Western Blot analysis of EPOR protein levels after treatment of cells with the selective PI3K/AKT signaling pathway inhibitor LY294002. d DC cells were treated with CEOP, EPOR blocker, or CEOP+EPOR blocker, as indicated. The expression of CD11b, CD80, CD86, and MHC-II in DC were evaluated by flow cytometric analysis. e qPCR analysis of the mRNA levels of IL-2, IFN-γ, TNF-α, IL-4, IL-5, IL-10 and IL-13 in CD4+ T cells treated with the CEOP, EPOR blocker, or CEOP+EPOR blocker, as indicated. f Western Blot analysis of IL-2, IFN-γ, TNF-α, IL-4, IL-5, IL-10, and IL-13 protein expression in CD4+ T cells treated with EPOR blocker, EPOR blocker + CEPO, or CEOP alone. g Influence of EPOR blocker, CEPO alone, and EPOR blocker + CEPO on the Th1, Th2, and Th1/Th2 ratio was determined by flow cytometry. Images shown are representative of at least three independent experiments, data are expressed as mean ± SEM (*p < 0.05, p values were calculated by Student’s t-test)

