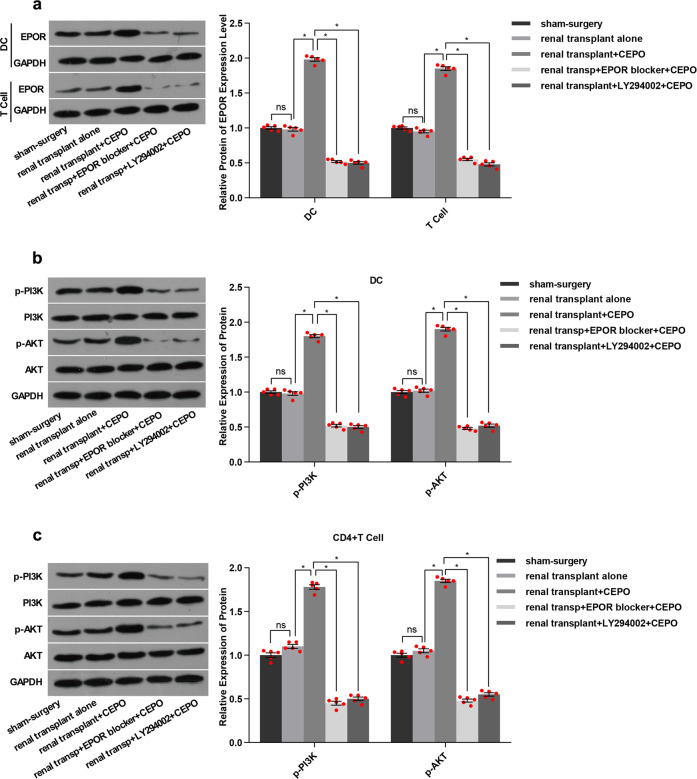
Fig. 7.
Influence of CEPO, EPOR blocker, and PI3K/AKT inhibitor on Protein levels of EPOR, PI3K, and AKT. a Protein expression of EPOR in DC and CD4+ T cells from renal transplant recipient. b Protein expression of PI3K and AKT in DC from renal transplant recipients. c Protein expression of PI3K and AKT in CD4+ T cells from renal transplant recipients. GAPDH was used to normalize each protein expression. The representative images of each group from 5 samples were shown. Data are expressed as mean ± SEM (*p < 0.05, p values were calculated by Student’s t-test)

