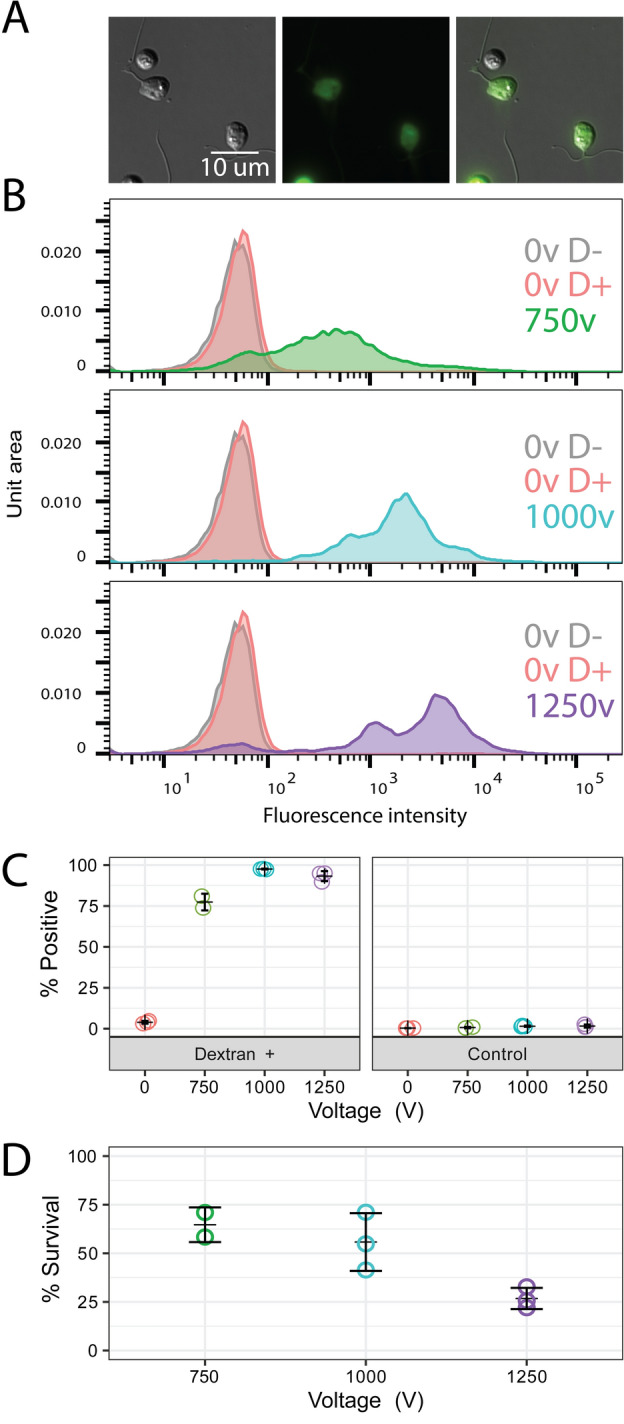
Figure 2.

Electroporation efficiency and survival of B. dendrobatidis at 750 V (green), 1000v (blue), and 1250 V (purple). (A) Representative images of cells after electroporation at 1000v showing live cells adhered to the slide and attempting amoeboid movement. (B) Representative flow cytometry data from a single replicate showing the fluorescence intensity of single cell events for non-electroporated, no dextran controls (grey); non-electroporated, dextran incubated controls (red); and electroporated, dextrans incubated treatments (colors vary by voltage). (C) Percent of single cell events with fluorescence intensities above the non-electroporated, no dextran control relative to all single cell events for three independent biological replicates. (D) Percent survival of cells in electroporated, dextran incubated controls in three independent biological replicates. Counts were normalized to the respective non-electroporated, no dextran controls.
