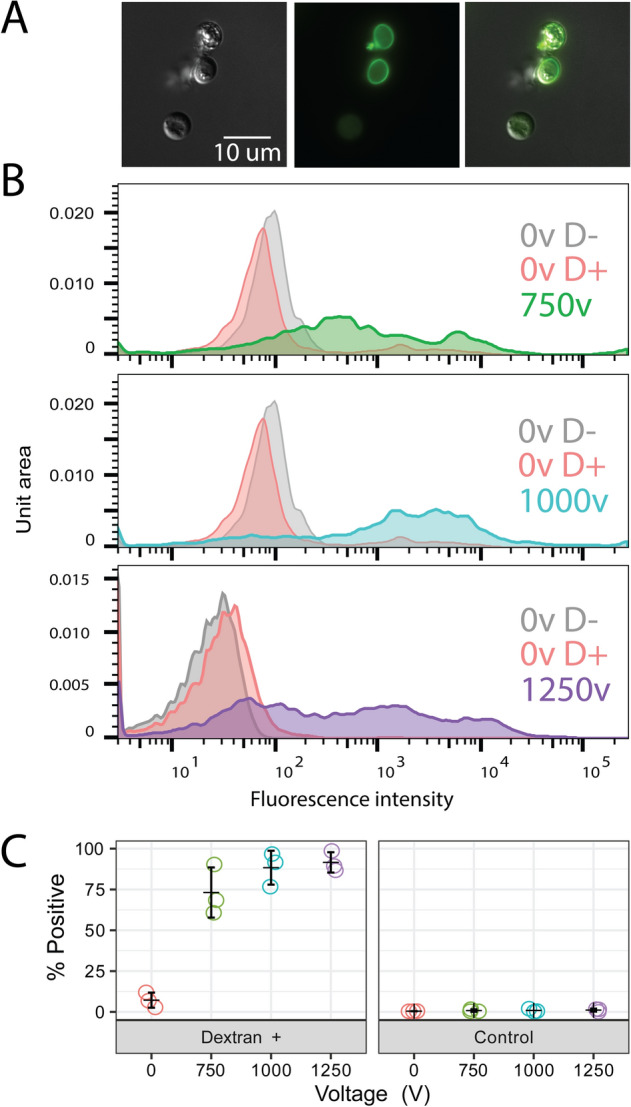
Figure 3.

Electroporation efficiency of B. salamandrivorans for 750 V (green), 1000 V (blue), and 1250 V (purple). (A) Representative images (DIC, FITC, Merged) from a single replicate at 1000 V showing positive cells with dextran inside the cell and not only stuck to the cell wall/coat. (B) Representative flow cytometry data from a single replicate showing the fluorescence intensity of single cell events for non-electroporated, no dextran controls (grey); non-electroporated, dextran incubated controls (red); and electroporated, dextran incubated treatments (colors vary by voltage). (C) Percent of single cell events with fluorescence intensities above the non-electroporated, no dextran control relative to all single cell events for three independent biological replicates.
