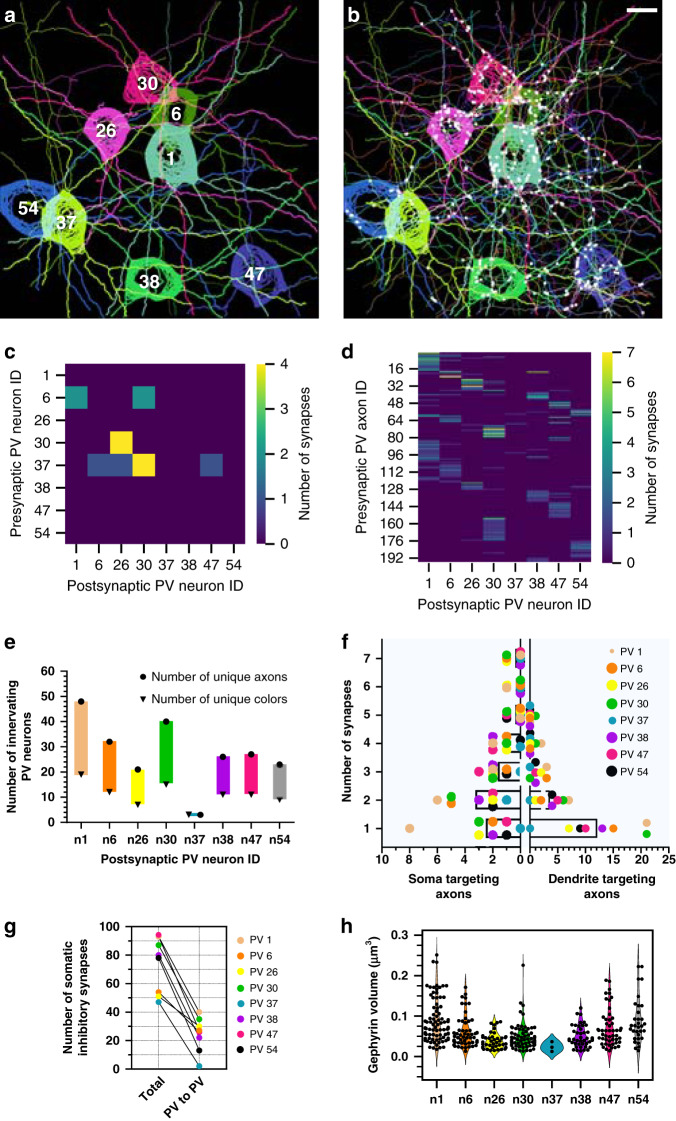
Fig. 4. Molecularly specific analyses can be performed on spectral connectomics data.
a Eight Brainbow labeled PV neurons reconstructed with nTracer. Thick neurites represent dendrites; thin neurites represent axons. The neuron IDs are overlaid. b Same as a, plus all of the other 189 innervating axons overlaid and 422 identified synapses marked with white circles. c Connectivity matrix between the eight reconstructed PV neurons. d Connectivity matrix as in c, plus the 189 innervating axons. e Plot of the maximum and minimum number of unique presynaptic PV neurons that innervate each of the eight postsynaptic PV neurons. Circles represent the number of spatially distinct PV axons that formed synapses, while triangles represent the number of unique colors that could be identified from the innervating axons. f Distribution of the number of soma targeting and dendrite targeting axons as a function of the number of synapses they form. Each of the eight afferent PV neurons are color coded and plotted with the average represented by the bar graph. g Total number of somatic inhibitory synapses were plotted relative to the PV to PV subset for each of the eight postsynaptic PV neurons. h Inhibitory PSD (Gephyrin) size plotted for all the PV to PV synapses found on each of the eight postsynaptic PV neurons. Scale bars: 10 μm (pre-expansion size).

