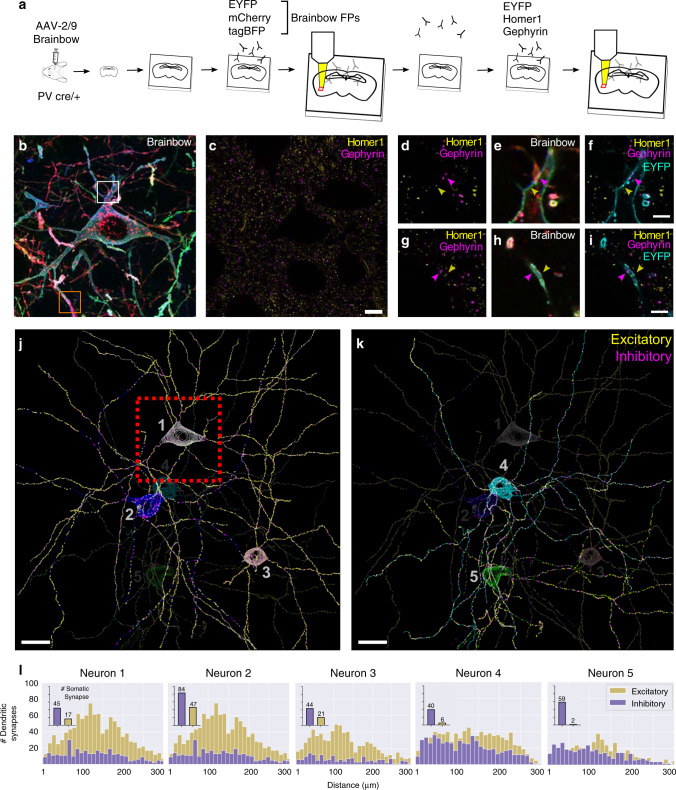
Fig. 5. Putative excitatory and inhibitory synapses of aspiny inhibitory neurons can be quantified.
a Experiment design: Brainbow and endogenous PSD markers are imaged across two rounds of immunostaining using the EYFP channel for registration. b MIP of the three Brainbow channels imaged in round 1. c Single slice of excitatory (Homer1) and inhibitory (Gephyrin) PSDs imaged in round 2. d–i Zoomed in synaptic marker + Brainbow single slice images of the white square (top row) and orange square (bottom row) respectively. Yellow and purple arrows point to excitatory and inhibitory synaptic puncta respectively. j, k nTracer reconstruction of five neurons’ morphology and putative synaptic inputs. The red box represents the field of view seen in b, c. l Histogram of the number of putative dendritic synapses as a function of dendritic length away from the soma for each neuron (n = 5 neurons from one experiment). The inset bar graph represents the number of putative somatic synapses for each neuron. Scale bars: (c) 10 μm (pre-expansion size), (f, i) 2.5 μm (pre-expansion size), (j, k) 20 μm (pre-expansion size). Expansion factor: (b–i) ~4×. See Supplementary Table 1 for more details.

