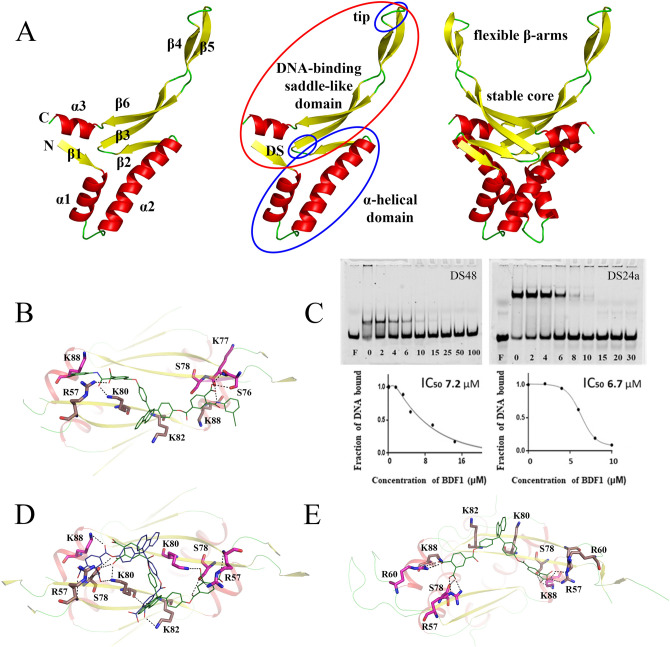
Figure 1.
Description of HUSpm domain structure and discovery of HUSpm inhibitors. (A) Left to right: secondary structure elements, domains and their subdivisions are shown on cartoon models of HUSpm monomer and dimer. DS—dimerization signal (GFGKF), tip—DNA-intercalating loop (GRNP). (B) Model of BDF1 (compound 5 from Supplementary Table S1) binding to the core of the HUSpm DNA-binding domain and polar interactions between BDF1 and positively charged or polar residues of HUSpm. Residues from different monomers are in magenta and beige colour, respectively. (C) Inhibition of HUSpm-DNA binding by different concentrations of BDF1, corresponding inhibition curves and IC50 values. Two different oligonucleotide duplexes—48 bp DS48 and 24 bp DS24a carrying a single nucleotide insertion in one strand—were used in the assay with similar results. (D) Model of BDF4 (Supplementary Table S3) binding to the core of the HUSpm DNA-binding domain in two locations and polar interactions between BDF4 and positively charged or polar residues of HUSpm. Residues from different monomers are in magenta and beige colour, respectively. (E) BDF4 position and polar interactions after 1,000 ns MD simulation.

