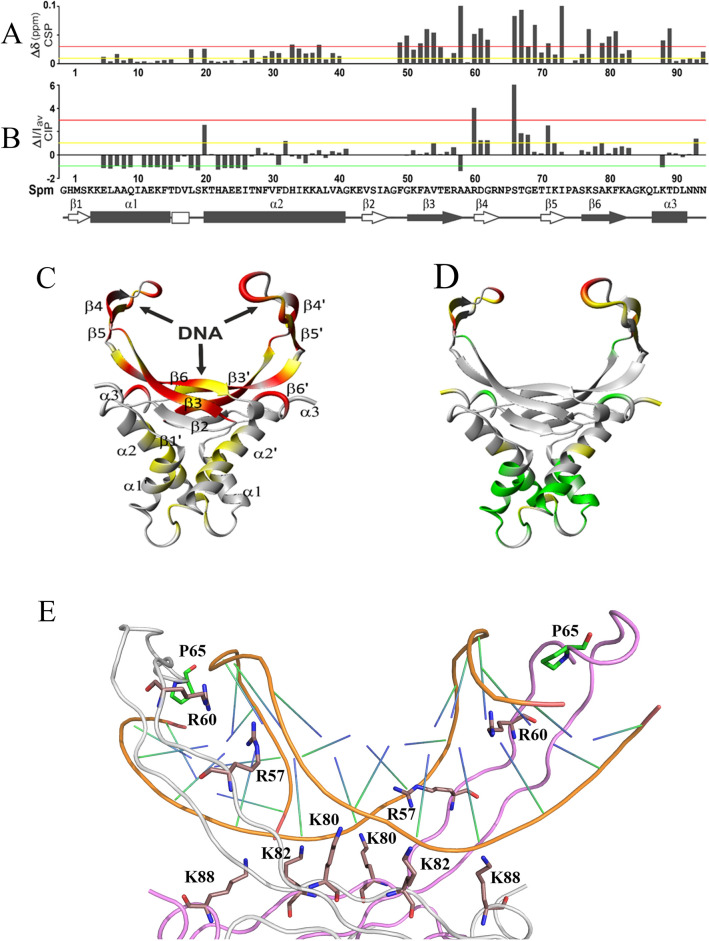
Figure 3.
Monitoring of chemical shift perturbations (CSPs) and cross-peak intensity perturbations (CIPs) of backbone amide groups of the HUSpm dimer upon DNA-binding. Weighted CSPs (A,C) and normalized CIPs (B,D) of HUSpm residues after binding DS14 shown as diagrams (A,B) and their color-coded mapping on ribbon models of the HUSpm dimer (C,D). Green, yellow and red lines in (A) and (B) are cutoff levels for the color-coding used in (C) and (D). (E) Model of HUSpm interacting with a DS14 duplex after 1,000 ns MD simulation. Two monomers are shown with gray and magenta lines. Basic residues from both monomers interacting with DNA through their side chains are shown in beige sticks; Pro65 intercalating into the DNA minor groove is in green.

