Fig. 2.
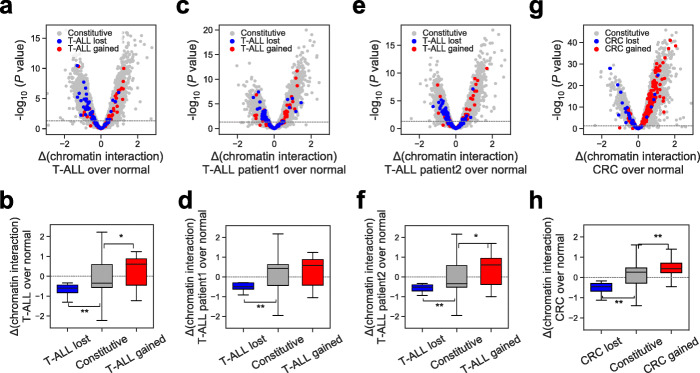
Gained/lost CTCF binding events associate with chromatin dynamics. a, c, e, g Volcano plots showing differential chromatin interaction levels between cancer and normal cells at cancer-specific lost (blue), gained (red), and constitutive (gray) CTCF binding sites, measured by Hi-C. Each point represents the interaction changes between a CTCF binding site and 5-kb bins located within 500 kb from the site. Horizontal dotted line represents p value cutoff of 0.05, by two-tailed paired Student’s t test. b, d, f, h Boxplots showing differential interaction frequencies between cancer and normal matched tissues for each group of CTCF binding sites. *, p < 0.05, **, p < 0.001, by two-tailed unpaired Student’s t test

