
Fig. 2. N2O fluxes from bomas (0.1–40 years old) and savanna sites.
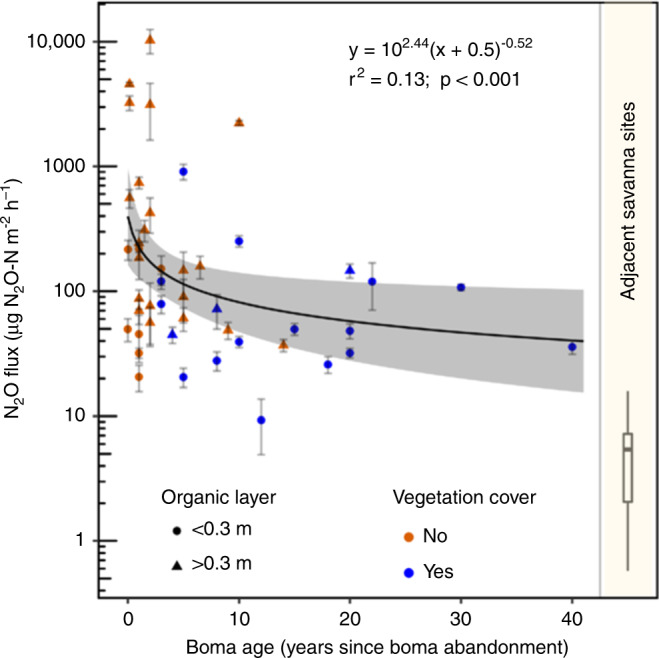
This figure shows data for bomas sampled in Kenya from 0.1 to 40 years in comparison with fluxes at adjacent savanna sites. Round symbols refer to boma sites with organic layer thickness of <0.3 m, whereas triangles indicate that the organic layer thickness is >0.3 m. Bomas without vegetation cover are marked by orange symbols, whereas blue symbols show bomas with vegetation cover. Details on the regression are given in Supplementary Table 2. The 95% confidence interval for the regression is highlighted in gray. Error bars indicate the standard error of the mean for each boma. Distribution of fluxes for adjacent savanna sites are summarized in a box plot (dark line depicts the median; box shows 25–75% percentiles, and whiskers depict range of measurements). Given their small magnitude, savanna sites were not considered as background in the boma flux calculations.