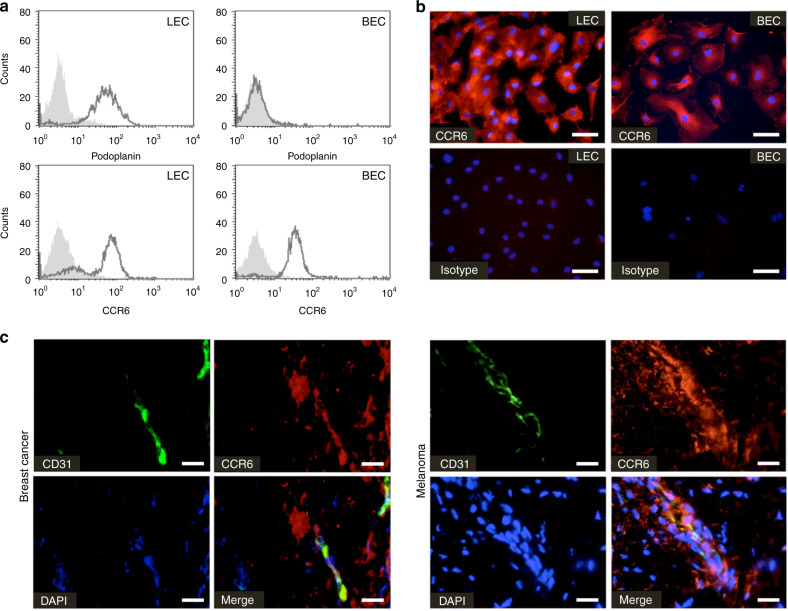
Fig. 3. Microvascular endothelial cells express CCR6 on their cell surface.
a Flow cytometric analysis of podoplanin and CCR6 protein surface expression in podoplanin-positive lymphatic microvascular endothelial cells (LEC) or podoplanin-negative blood microvascular endothelial cells (BEC) (black line). Filled histogram shows isotype control. b Immunofluorescence analysis of CCR6 (red) expression of LECs and BECs [scale bars represent 50 µm]. c Immunofluorescence analysis of CD31 (green) and CCR6 (red) expression in marginal zones of a breast cancer tumour and melanoma demonstrates the co-localisation of CCR6 with microvessels in the tumour microenvironment [scale bars represent 25 µm]. CCR6 seems also expressed by cancer cells, stromal cells and immune cells infiltrating the tumour.

