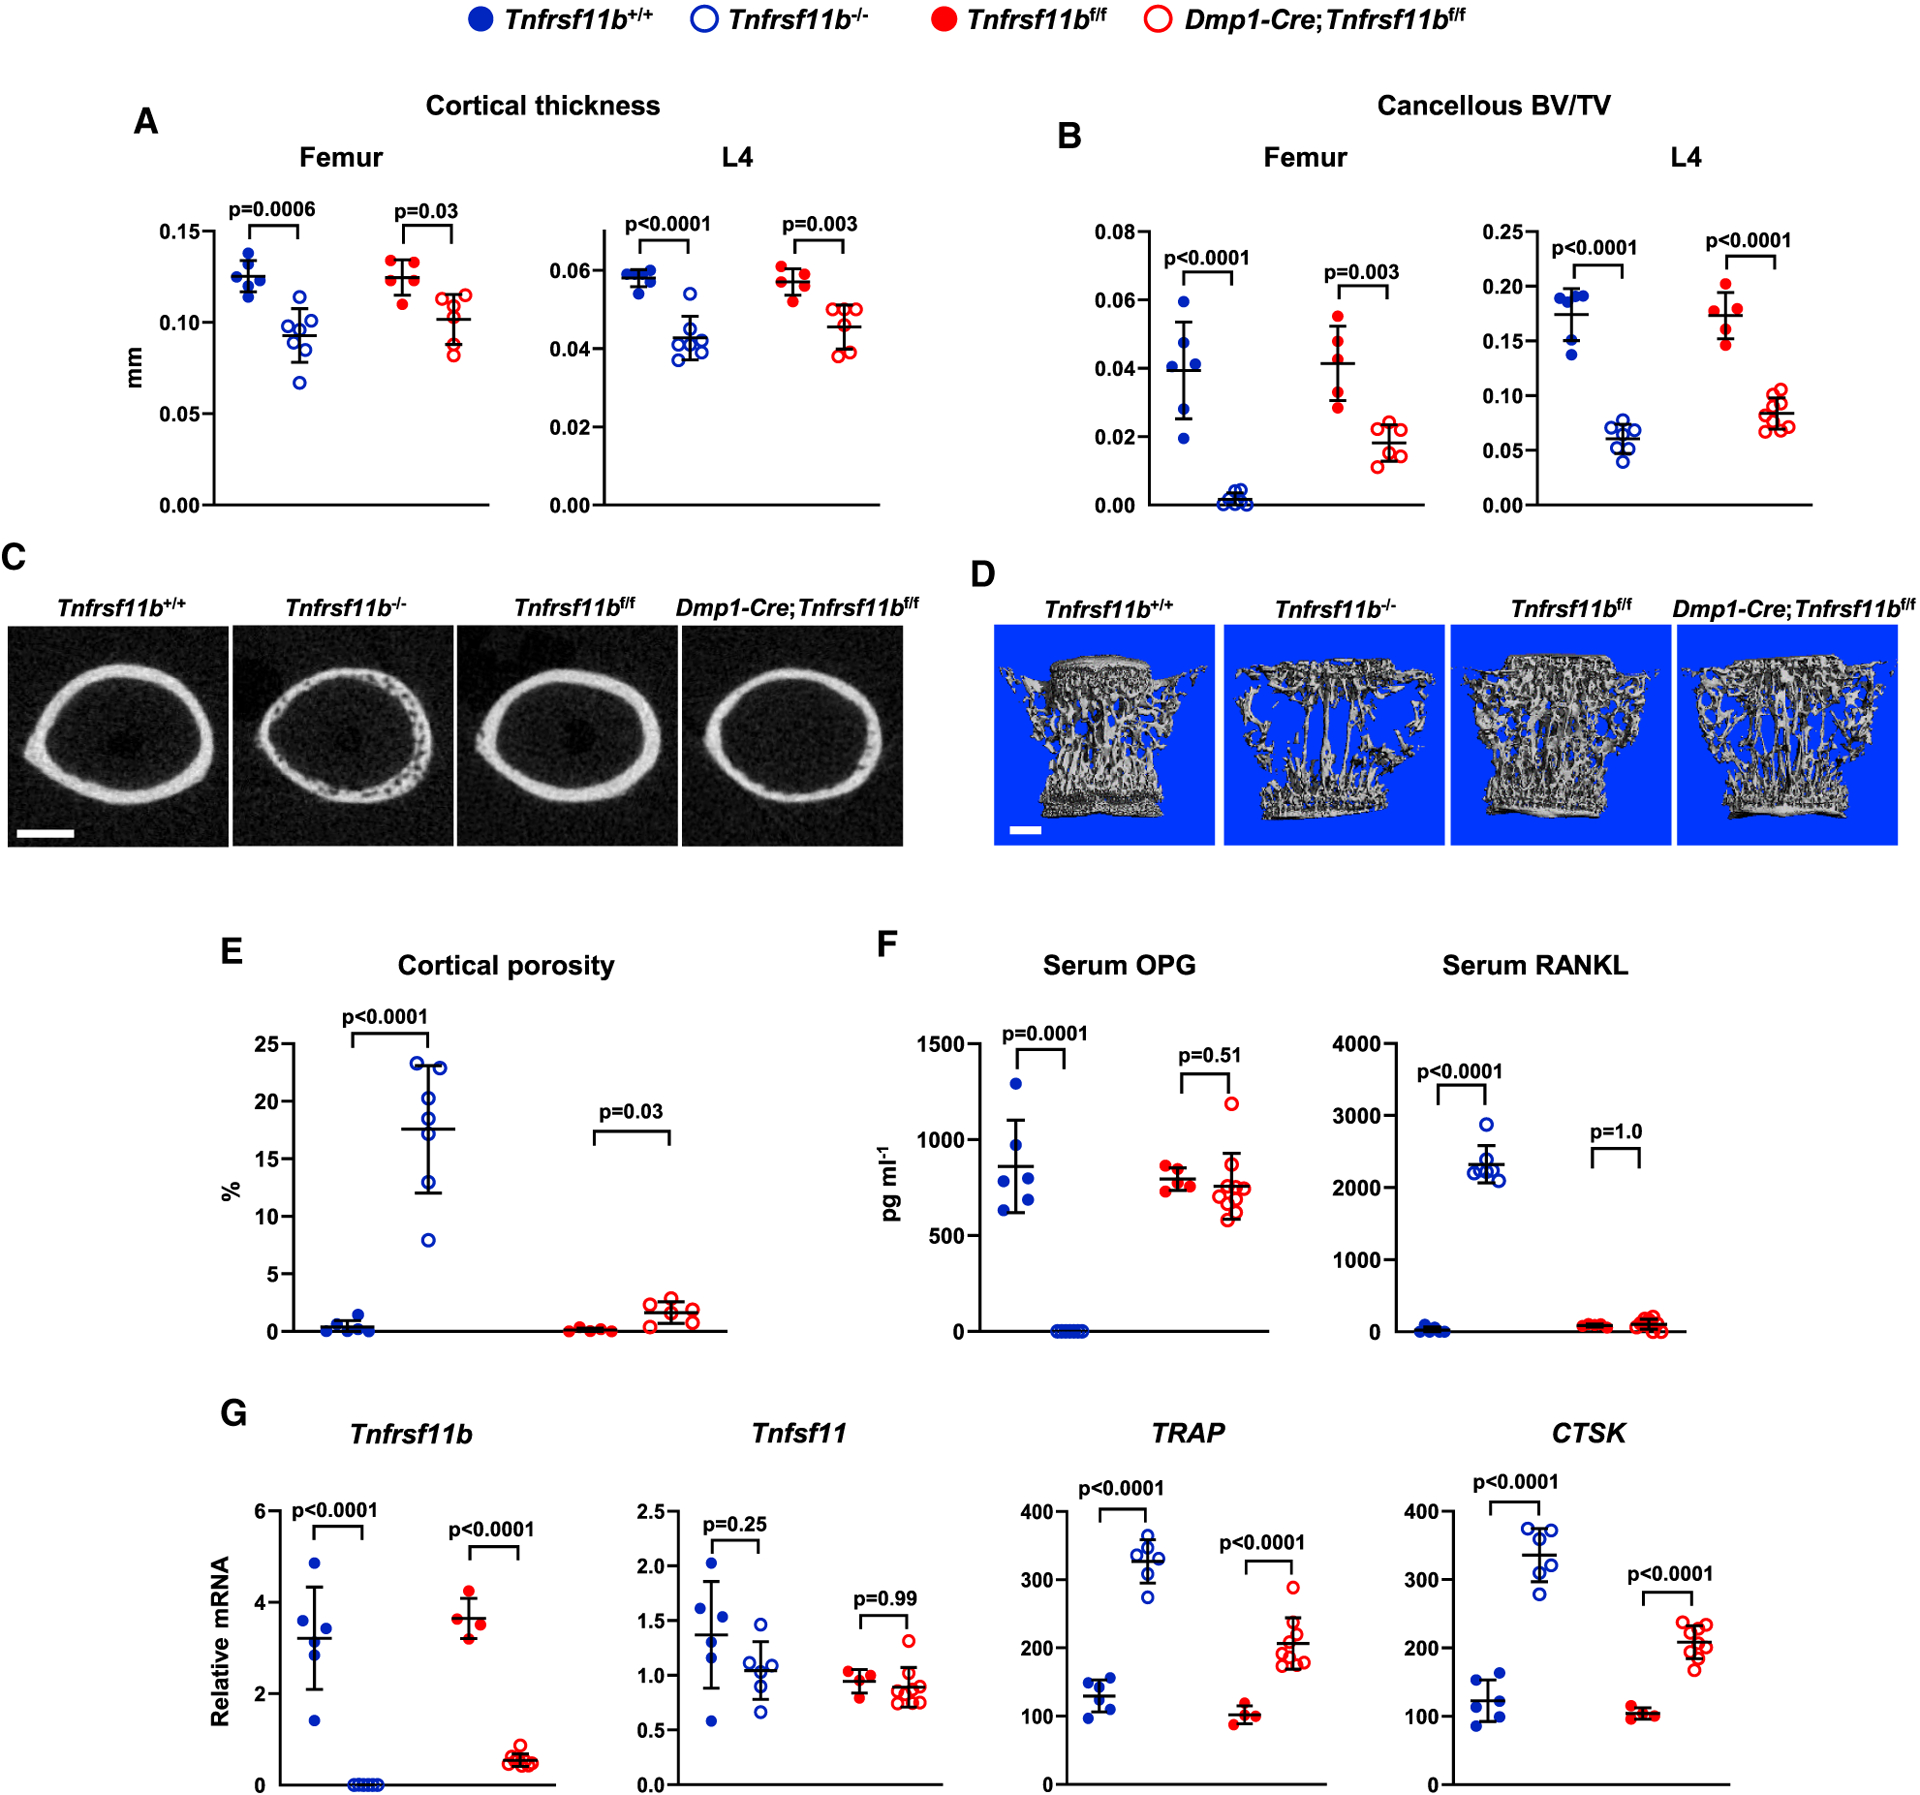
Figure 2. Deletion of Tnfrsf11b from Mature Osteoblasts and Osteocytes Decreases Bone Mass.

(A) Cortical thickness in the femur and L4 vertebra measured by μCT (n = 5–7).
(B) Cancellous BV/TV of femurs and L4 vertebra (n = 5–9).
(C) Cross sections of the femoral diaphysis viewed by μCT. Scale bar, 500 μm.
(D) μCT images of vertebral cancellous bone. Scale bar, 500 μm.
(E) Quantitative analysis of femoral cortical porosity measured by μCT (n = 5–7).
(F) Soluble OPG and RANKL in the serum measured by ELISA (n = 5–10).
(G) Tnfrsf11b, Tnfsf11, TRAP, and CTSK mRNA levels in tibial cortical bone (n = 4–9). All values are from 5-week-old female mice of the indicated genotypes, and bars are means ± SD. Cortical thickness and BV/TV values for Tnfrsf11b+/+ and Tnfrsf11b−/− mice are the same as in Figure 1. The indicated p values were determined by one-way ANOVA.
See also Figures S1, S3, and S4 and Data S1.
