
Figure 3. Mitogens Activate mdm2 Regulatory Sequences and Have Increased Potency in tp53−/− Mutants.
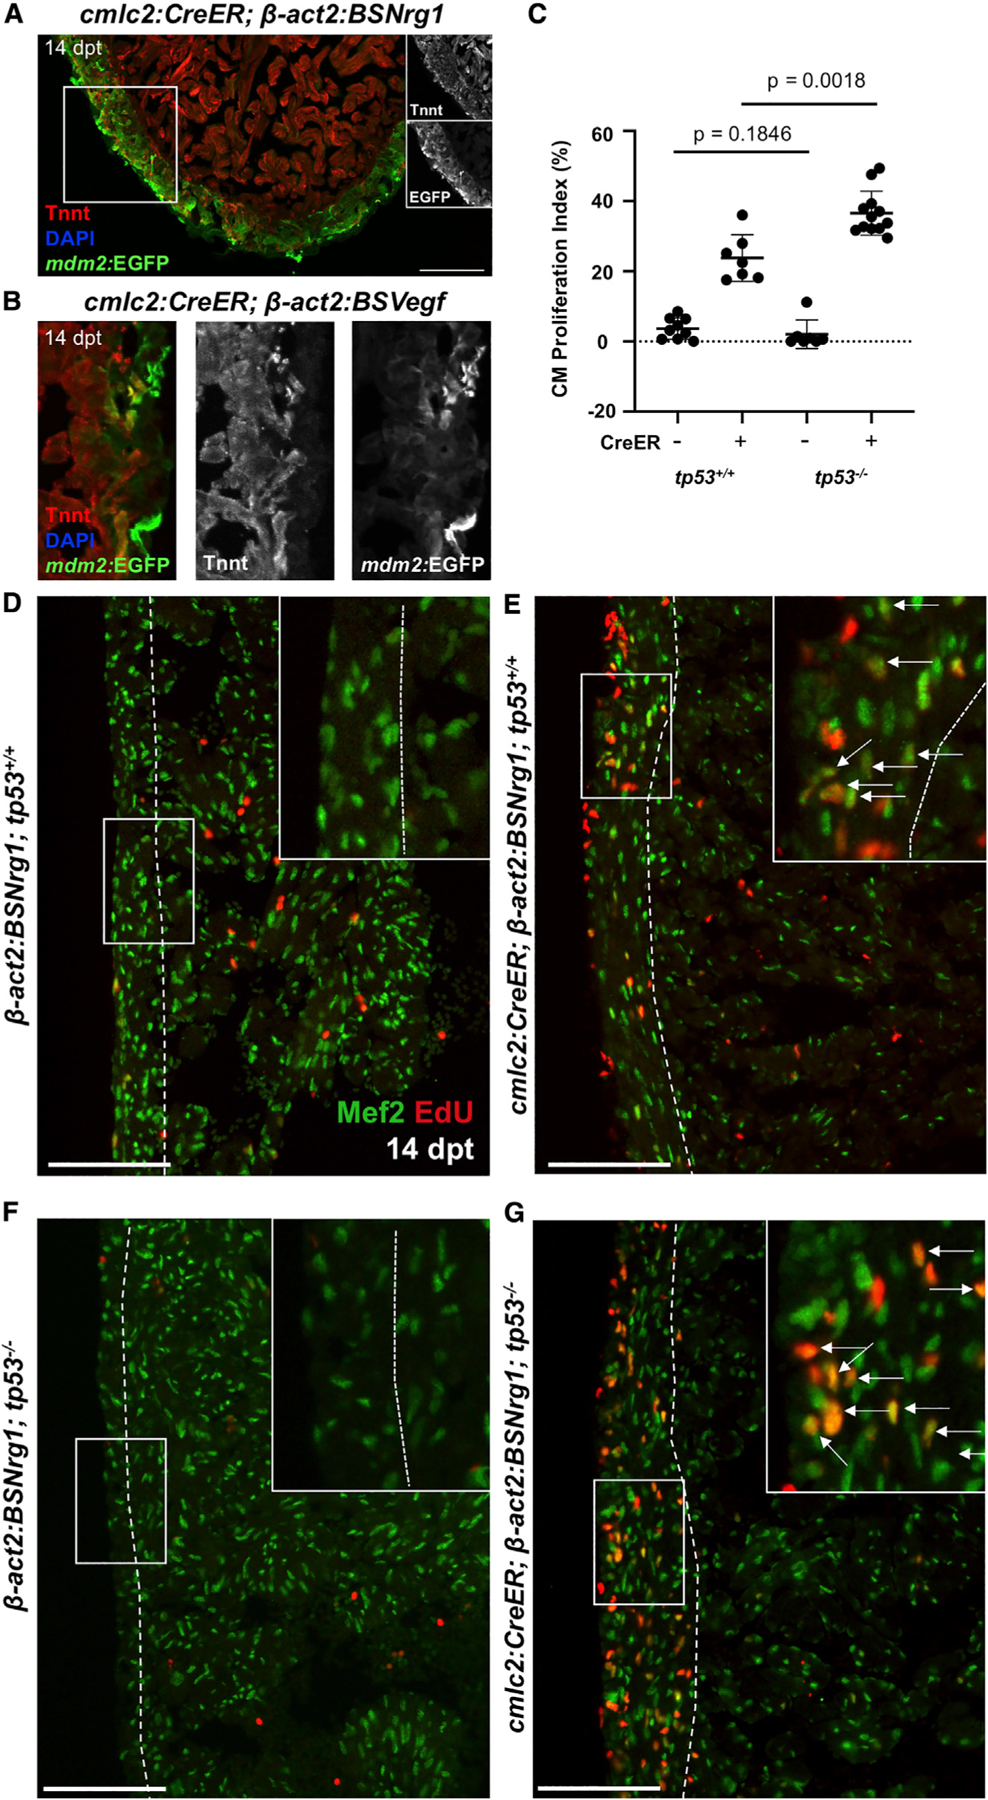
(A and B) mdm2:EGFP expression is activated in the ventricular wall after induced nrg1 (A) or vegfaa (B) overexpression (dpt, days post tamoxifen administration). High-magnification views only shown in (B).
(C) Quantification of CM EdU incorporation indices in ventricular walls of control (CreER−) or nrg1-overexpressing hearts at 14 dpt in tp53+/+ and tp53−/− backgrounds. n = 9 and n = 7 for tp53+/+ CreER− and CreER+, respectively. n = 7 and n = 12 for tp53−/− CreER− and CreER+, respectively.
(D–G) Section images of ventricular walls from groups in (C), indicating greater Nrg1-induced EdU incorporation in Mef2+ cells in tp53−/− ventricles. Boxes correspond to the region magnified in adjacent panels. Arrows indicate Mef2+EdU+ cells CMs. Scale bars: 100 μm. Data show mean ± SEM (Mann-Whitney U test).