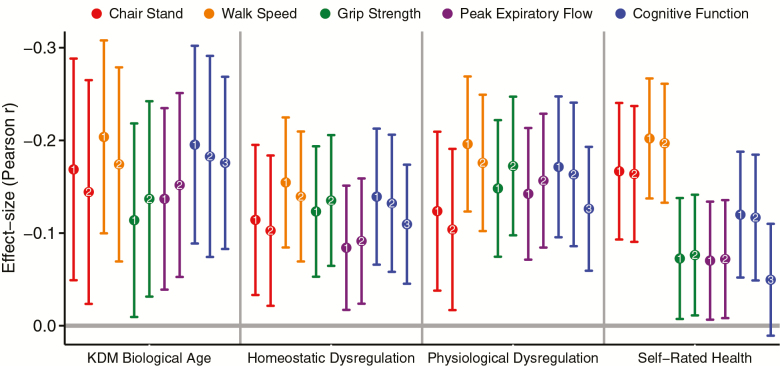
Figure 1.
Effect sizes for associations of aging measures with tests of physical performance, cognitive functioning, and cognitive decline. Plotted points are standardized regression coefficients reflecting effect sizes interpretable as Pearson’s r. Error bars show 95% confidence intervals. Points are labeled as reflecting effect sizes from different regression models. The first model, denoted with the number 1, included chronological age and sex as covariates. The second model, denoted with the number 2, included chronological age, sex, and body mass index in 2000 as covariates. For analysis of cognitive function (in blue), we report a third model, denoted with the number 3. This model estimates an effect size for cognitive decline by including the participant’s cognitive test score in 2000 as a covariate in the model predicting cognitive test score in 2006. Full results from regression models are reported in Supplementary Tables 4–8.

