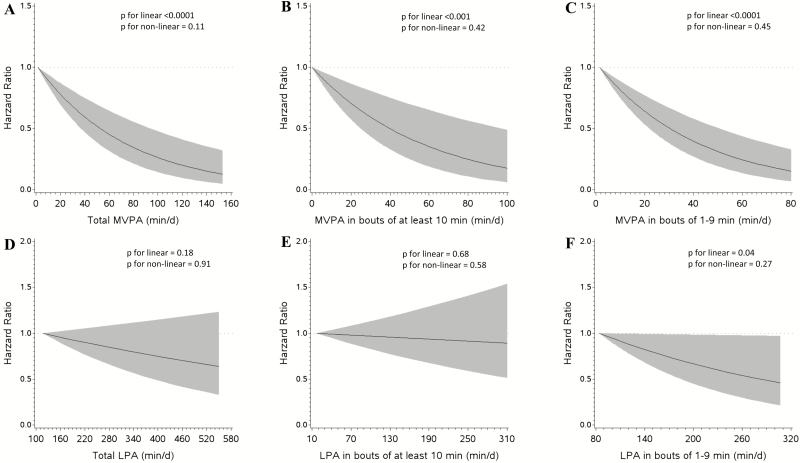
Figure 1.
Dose–response associations of MVPA measures and LPA with functional disability. Models were fit for each physical activity measure using cubic restricted splines, with three knots at the 5th, 50th, and 95th percentiles. Lowest value of each physical activity was set as the reference. Results are trimmed at the 1st and 99th percentiles and reported as HRs (black line) and 95% CIs (shaded area). CI = confidence interval; HR = hazard ratio; LPA = light physical activity; MVPA = moderate-to-vigorous physical activity.

