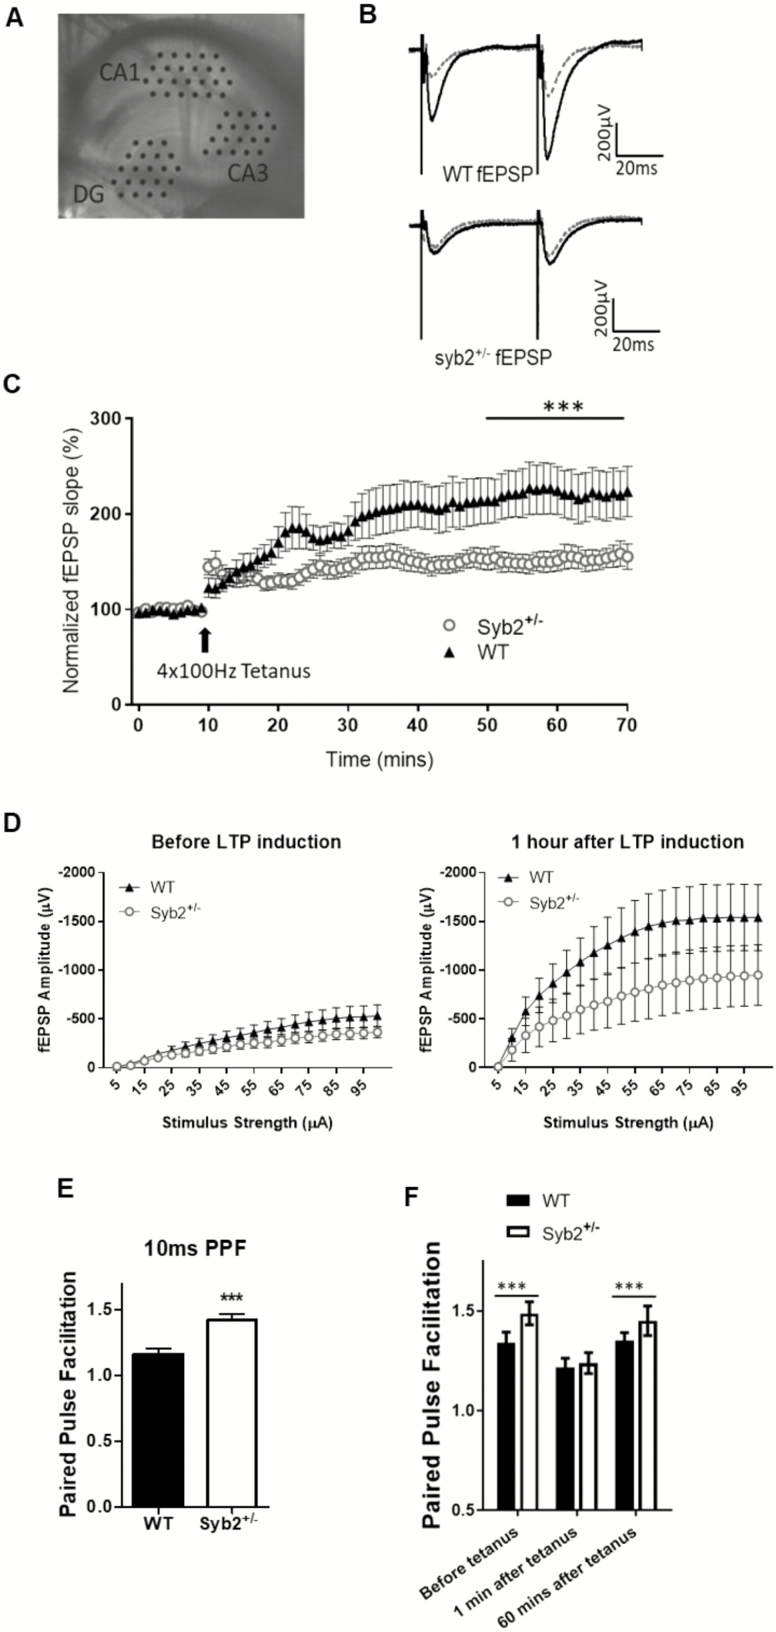
Figure 4.
Reduced synaptic potentiation of hippocampal CA1 synapses in synaptobrevin-2+/− mice. (A) Picture of hippocampal slice in MED 64 probe with electrodes positioned on the dentate gyrus (DG), CA3, and CA1 regions. (B) Representative traces for syb2+/− and wild-type (WT) before (grey line) and after (black traces) long-term potentiation (LTP) induction. (C) Normalized fEPSP for both syb+/− (◯; n = 8 animals) and WT (▲; n = 7 animals) depicting syb2+/− animals have impaired LTP (p < .001; two-way repeated-measures [RM] analysis of variance [ANOVA]). (D) Input–output curves depicting syb2+/− animals have a significantly muted response to a range of stimuli after LTP induction (p < .014; two-way RM ANOVA). (E) Ratio of amplitudes in paired-pulse facilitation (PPF) at 10 ms for both WT and syb2+/− animals. Syb2+/− animals have a significantly higher PPF ratio than WT controls at 1.42 ± 0.04 and 1.16 ± 0.05, respectively; p < .001; two-tailed t test. (F) Ratio of amplitudes showing that syb2+/− neurons also have a higher PPF ratio at 50 ms before LTP induction (1.49 ± 0.008 and 1.34 ± 0.003, respectively) and 1 hour after (1.45 ± 0.003 and 1.35 ± 0.002, respectively; p < .001; two-way ANOVA).

