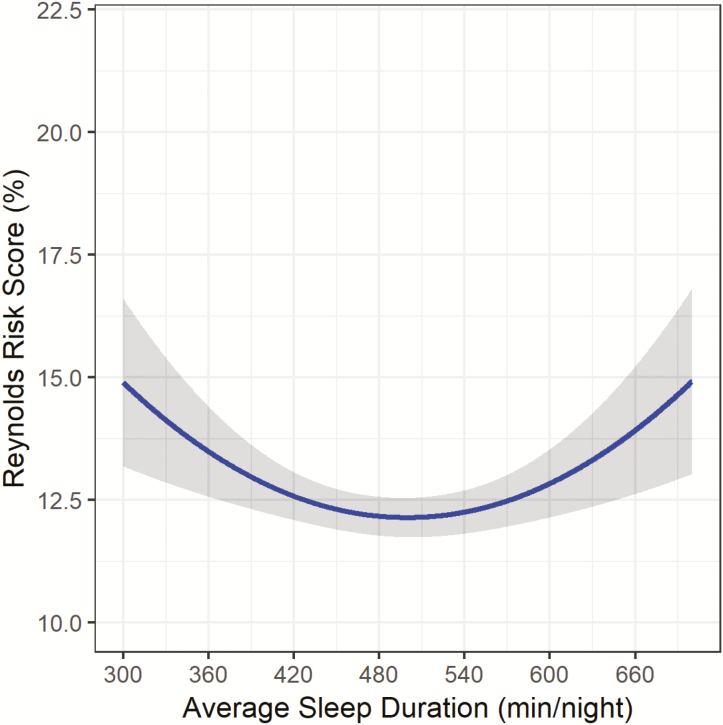
Figure 3.
Sleep Duration and Reynolds Risk Score in the OPACH Sleep Cohort after final adjustment1. 1Model adjusted for race/ethnicity, education, alcohol intake, physical activity, sleep medications, sleep disturbances, body mass index, physical functioning, depression, self-rated health, and comorbidity index. *Gray shading represents 95% Confidence Interval.

