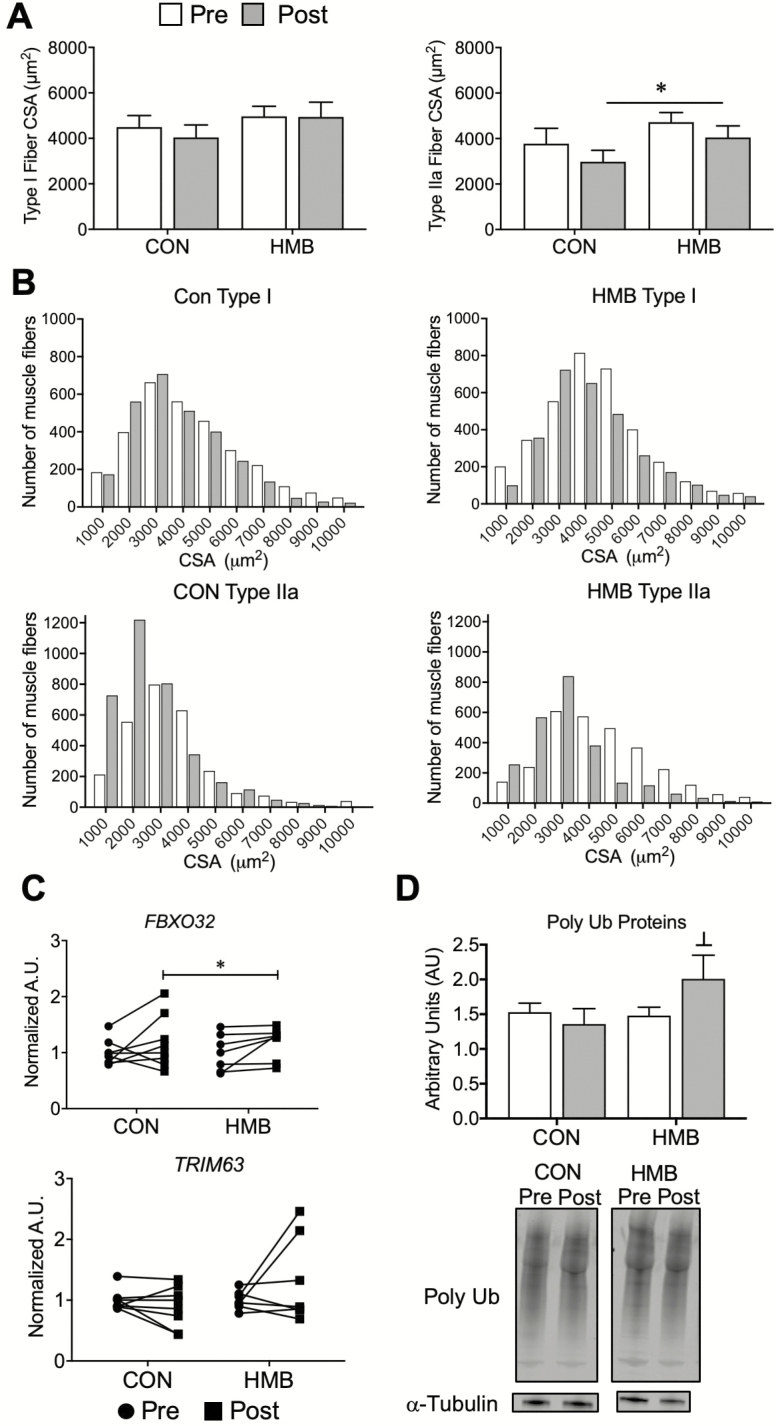
Figure 1.
Older adults display reductions in type IIa skeletal muscle fiber cross-sectional area (CSA) and elevations in skeletal muscle markers of atrophy following 10 days of bed rest (BR). (A) Type I and type IIa, and (B) frequency histograms of skeletal muscle fiber CSA depicting sampled vastus lateralis muscle fibers pre- and post-10 days of BR; n = 9–12 per group. † main effect for time for both groups: Type IIa CSA (Time Effect: p = .03, Interaction: p = .85). (C) Gene expression of atrophy markers and (D) western blot and representative images pre- and post-10 days BR. Vertical dividing lines were used in Western blot images to present lanes from the same gel that were reorganized for presentation purpose; n = 5–9 per group. † trend for main effect for time for both groups: atrogin-1 (Time Effect: p = .069, Interaction: p = .97); ┴ Trend for a group effect from pre-BR: poly-ubiquinated proteins (Group Effect: p = .078, Interaction: 0.10).

