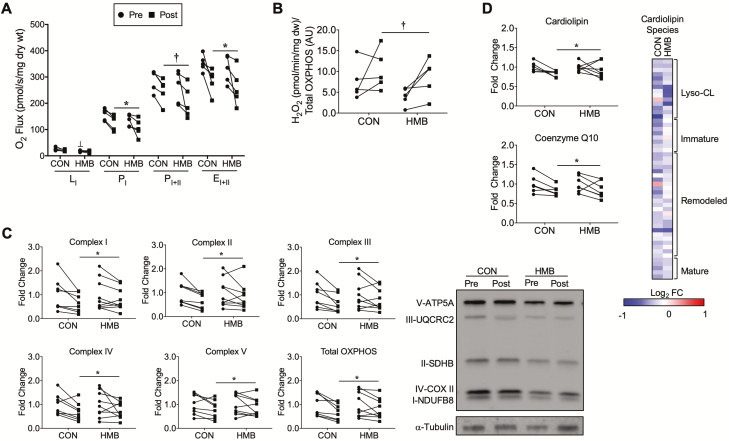
Figure 4.
Skeletal muscle mitochondrial function, OXPHOS, cardiolipin, and coenzyme Q10 content are reduced, and H2O2 emission is elevated following 10 days of BR. (A) Mitochondrial respiratory capacity was measured in permeabilized fiber bundles and reported as O2 flux normalized to the dry weight of the fiber bundles; n = 5 per group. (B) Mitochondrial H2O2 emission was measured in permeabilized fiber bundles and reported as H2O2 emission normalized to total OXPHOS content; n = 5 per group. (C) Skeletal muscle mitochondria oxidative phosphorylation (OXPHOS) content pre- and post-10 days of BR and representative Western blot images; n = 8–9 per group. Pre- and post-BR data are reported as fold change from pre-BR. (D) Skeletal muscle total cardiolipin and coenzyme Q10 pre- and post-10 days of BR; n = 6–7 per group. ┴ Significant group effect for HMB group pre-BR (Group Effect: p = .008, Interaction: p = .44), * Significant time effect for PI (Time Effect: p = .03, Interaction: 0.91) and EI+II (Time Effect: p = .01, Interaction: p = .96) to be reduced in both groups following BR, and † trend for time effect for PI+II (Time Effect: p = .059, Interaction: p = .71) to be reduced in both groups following BR. † trend for time effect for H2O2 emission to be elevated in both groups following 10 days of BR (Time Effect p = .056, Interaction: p = .61). * Significant time effect for reductions in both groups for total OXPHOS content (Time Effect: p = .002, Interaction: p = .34), complex I (Time Effect: p = .005, Interaction: p = .31), complex II (Time Effect: p = .008, Interaction: p = .32), complex III (Time Effect: p = .004, Interaction: p = .28), complex IV (Time Effect: p = .017, Interaction: p = .76) and complex V (Time Effect: p = .03, Interaction: p = .64). * Significant time effect for cardiolipin (Time Effect: p = .04, Interaction: 0.42) and † trend for time effect for coenzyme Q10 (Time Effect: p = .0577, Interaction: p = .92) to be reduced following BR. The heat map represents the log2 fold change of all cardiolipin species during BR in the CON and HMB groups. The cardiolipin species are grouped according to the maturation status of each species. n = 5 per group. Red (up-regulated) and blue (down regulated) dots represent significantly changed metabolites during BR.

