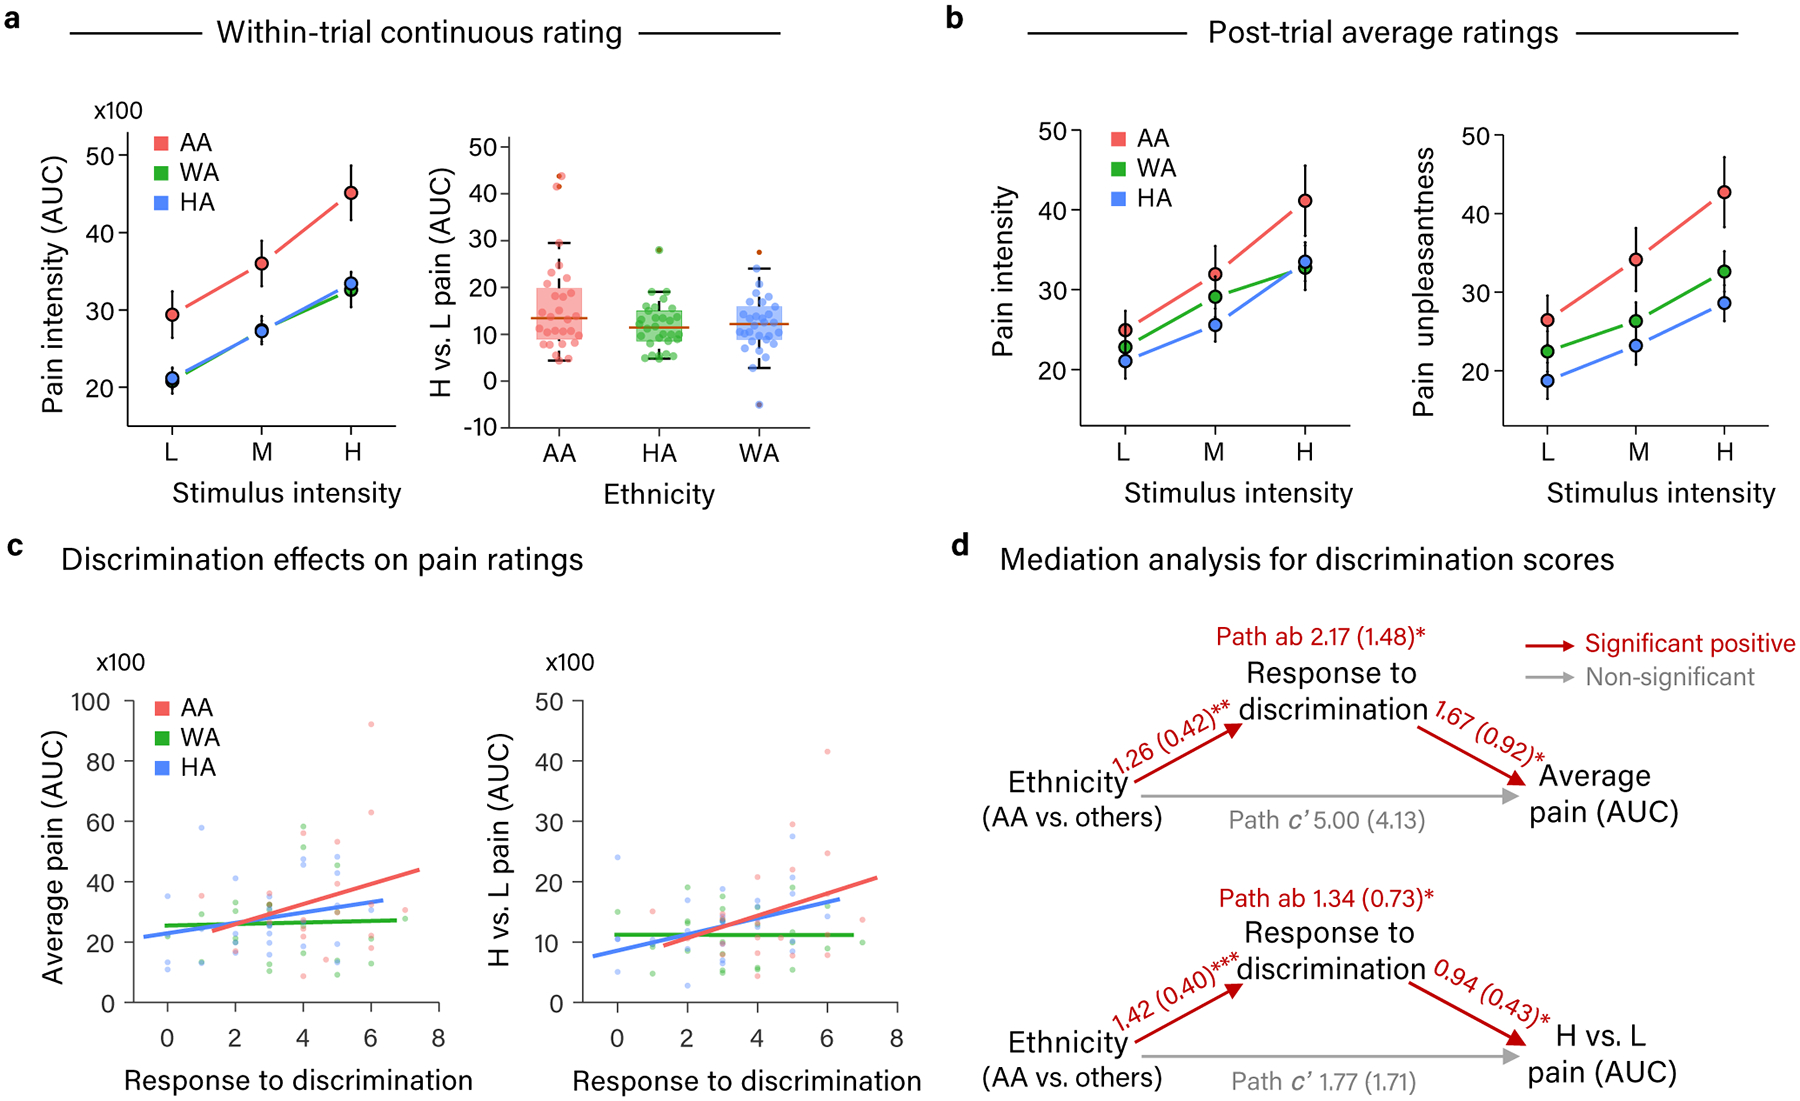
Figure 2.

Differences in pain rating across ethnic groups and mediation by discrimination. (a) Graphs of mean area under the curve of within-trial pain intensity rating (present on all trials) at each temperature of heat stimulation (left: line plot) and the difference between high and low heat stimulation (right: box plot) in each ethnic group. Box plot elements: red center line, median; box limits, upper and lower quartiles; whiskers, limits of non-outlier data; points matched to box shading, subject means; dark red points, outliers. (b) Graphs of mean post-trial pain intensity (left graph) and pain unpleasantness (right graph) rating (present on 1/4 of trials) at each temperature of heat stimulation in each ethnic group. (a-b) AA participants rated pain as more intense and unpleasant than HA and WA participants and exhibited a steeper dose-response relationship with painful stimulus intensity. Error bars represent within-subject standard error of the mean (SEM). Data are from 88 participants. (c) Relationship between participants’ frequency of responding to discrimination (e.g., by filing a complaint) and the area under the curve of their within-trial pain intensity rating. Average pain rating across three stimulation temperatures is depicted in the left panel, and average pain rating for high minus low temperatures is depicted on the right panel. (a-c) Values for area under the curve of continuous within-trial pain intensity rating depicted on Y axes have been divided by 100. (d) Path diagrams and statistics for mediation analyses of participant ethnicity effects [AA vs (HA +WA)] on pain rating by participants’ frequency of responding to discrimination. Participants’ frequency of responding to discrimination significantly mediated higher pain reports and a steeper dose-response relationship with painful stimulus intensity in AA compared to HA and WA participants. Path coefficients are listed for each path with standard errors in parentheses. * = p < .05, ** = p < .01, *** = p < .001. (c-d) Data are from the 81 participants who completed the response to discrimination measure.
