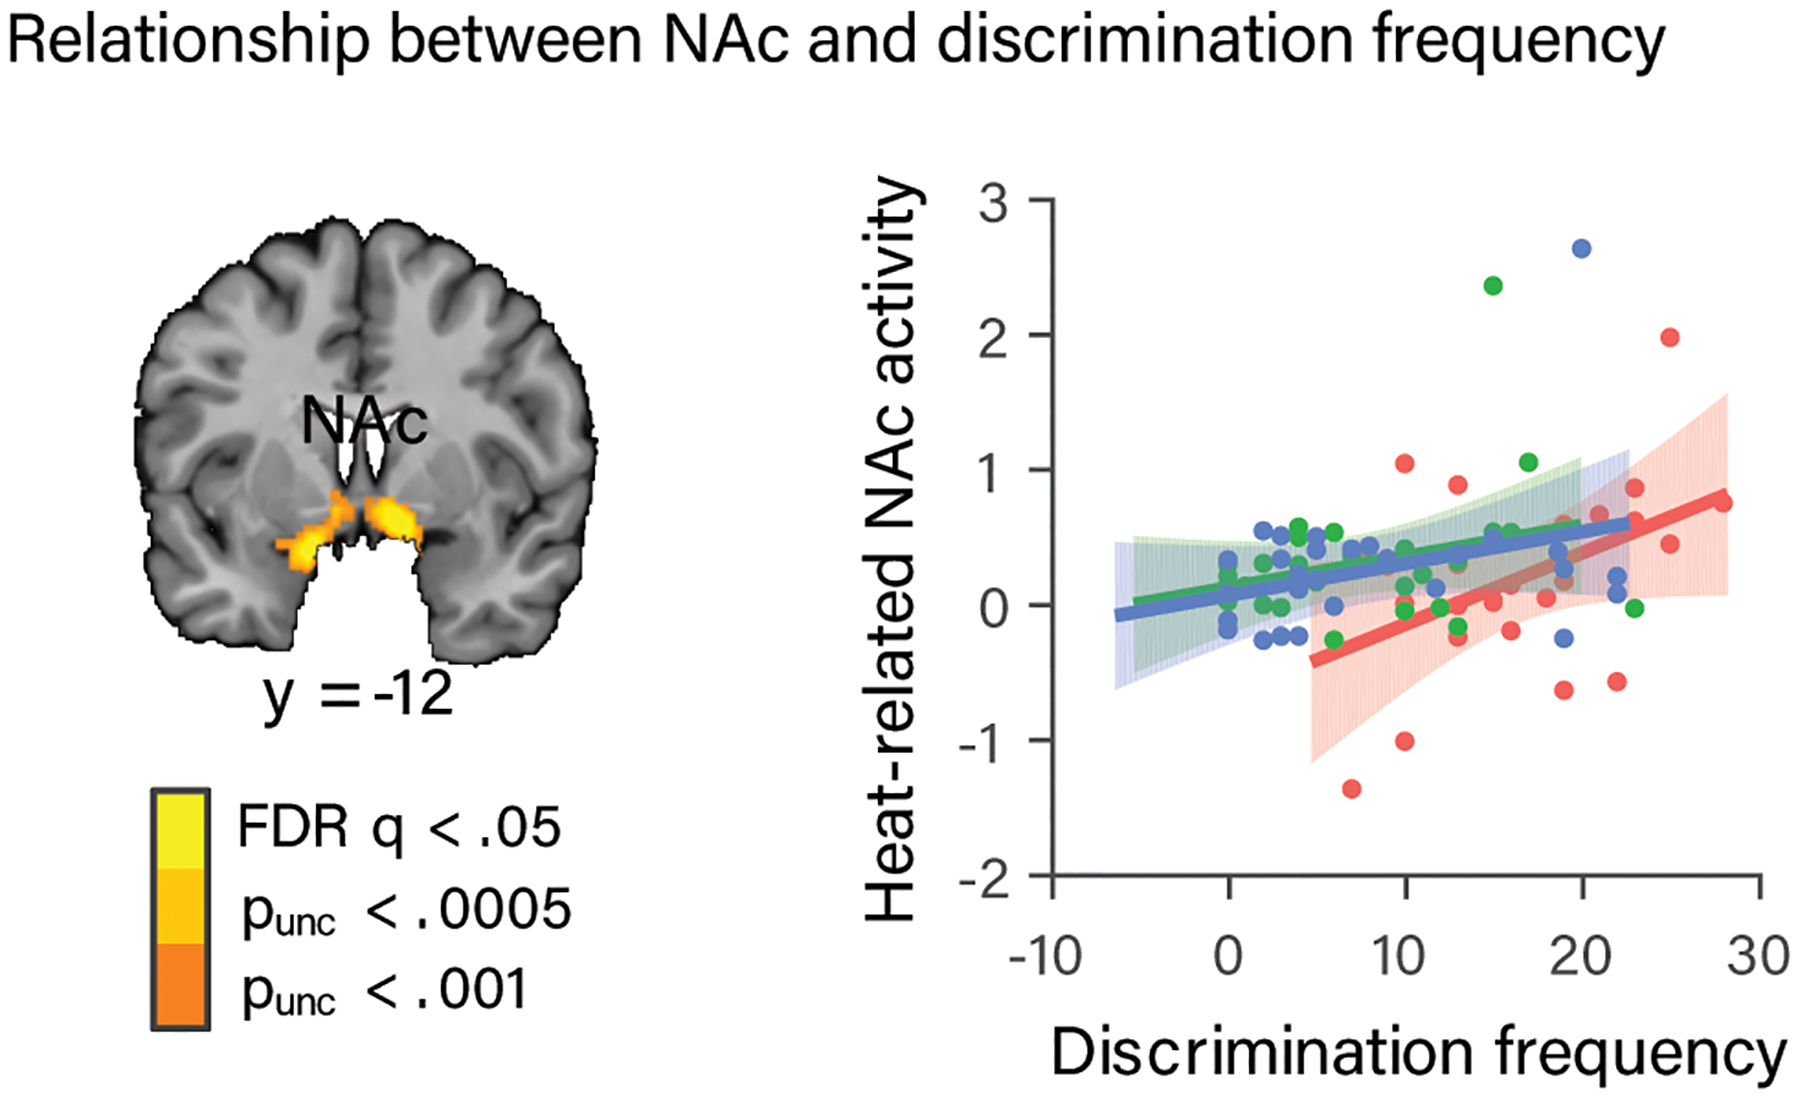
Figure 5.

Relationship between NAc activity and discrimination frequency. (a) NAc region from the whole-brain analysis identified as exhibiting a steeper dose-response effect of stimulus intensity on brain activity in AA participants. (b) Painful heat-related activity (parameter estimates) from this NAc region plotted as a function of discrimination frequency, with regression lines and standard error bands for each ethnic group. Average activity during painful heat within this NAc region increased with increasing discrimination frequency, and this relationship was stronger for the AA than non-AA (HA + WA) group. Dots indicate individual participants. Data are from the 83 participants who completed the discrimination frequency measure.
