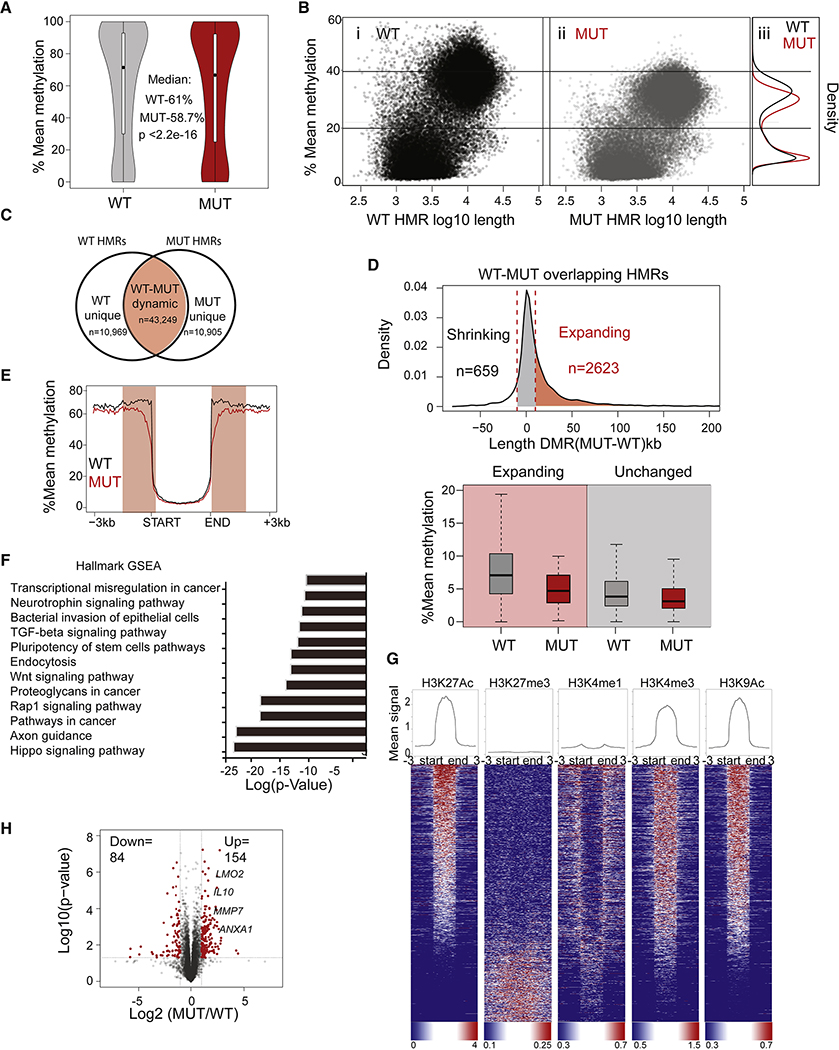
Figure 2. Loss of DNMT3A leads to focal hypomethylation and expansion of low methylation regions.
(A) Violin plots of genome-wide mean methylation of single CpGs grouped from 2 WT (gray) and 2 DNMT3A-MUT clones (red). (B) Scatter plot depicting WT (i) and DNMT3A-MUT LCLs (ii). Density plots (iii) depicting the distribution of the mean methylation of the WT and MUT hypomethylated regions (HMRs). (C) Venn diagram showing overlap of WT and DNMT3A-MUT HMRs. Overlapping, dynamic HMRs are regions that change either in methylation or length in MUT LCLs (D) Top: Density plot distribution depicting the change in HMR length for dynamic HMRs with mean methylation <10% and length> 2.5 kb. Delta length is the change in base pairs (bp) for these dynamic HMRs. Marked are DNMT3A-MUT HMRs that expanded in length (red) or were unchanged (gray). Bottom: Box plot of mean DNA methylation. (E) Mean methylation across canyons (>3 Kb and <10% methylation) for WT LCLs. (F) Enrichment based on p-value score for the identified GSEA pathways after the expanding HMRs (from D) were annotated using HOMER. (G) Quantification of signal (top) and heatmap enrichment (bottom) of the indicated histone marks across the expanding regions from LCLs (from Fig. 2D). (H) RNA-seq analysis for 3 WT (each in duplicate) and 4 DNMT3A-MUT clones (in duplicate). Differentially expressed genes between WT and MUT LCLs based on RNAseq fold-change and p-values. (H) Gene Ontology pathway enrichment of differentially expressed genes (fold>2, p<0.05) between WT and MUT clones plotted based on log transformed p-value enrichment score.

