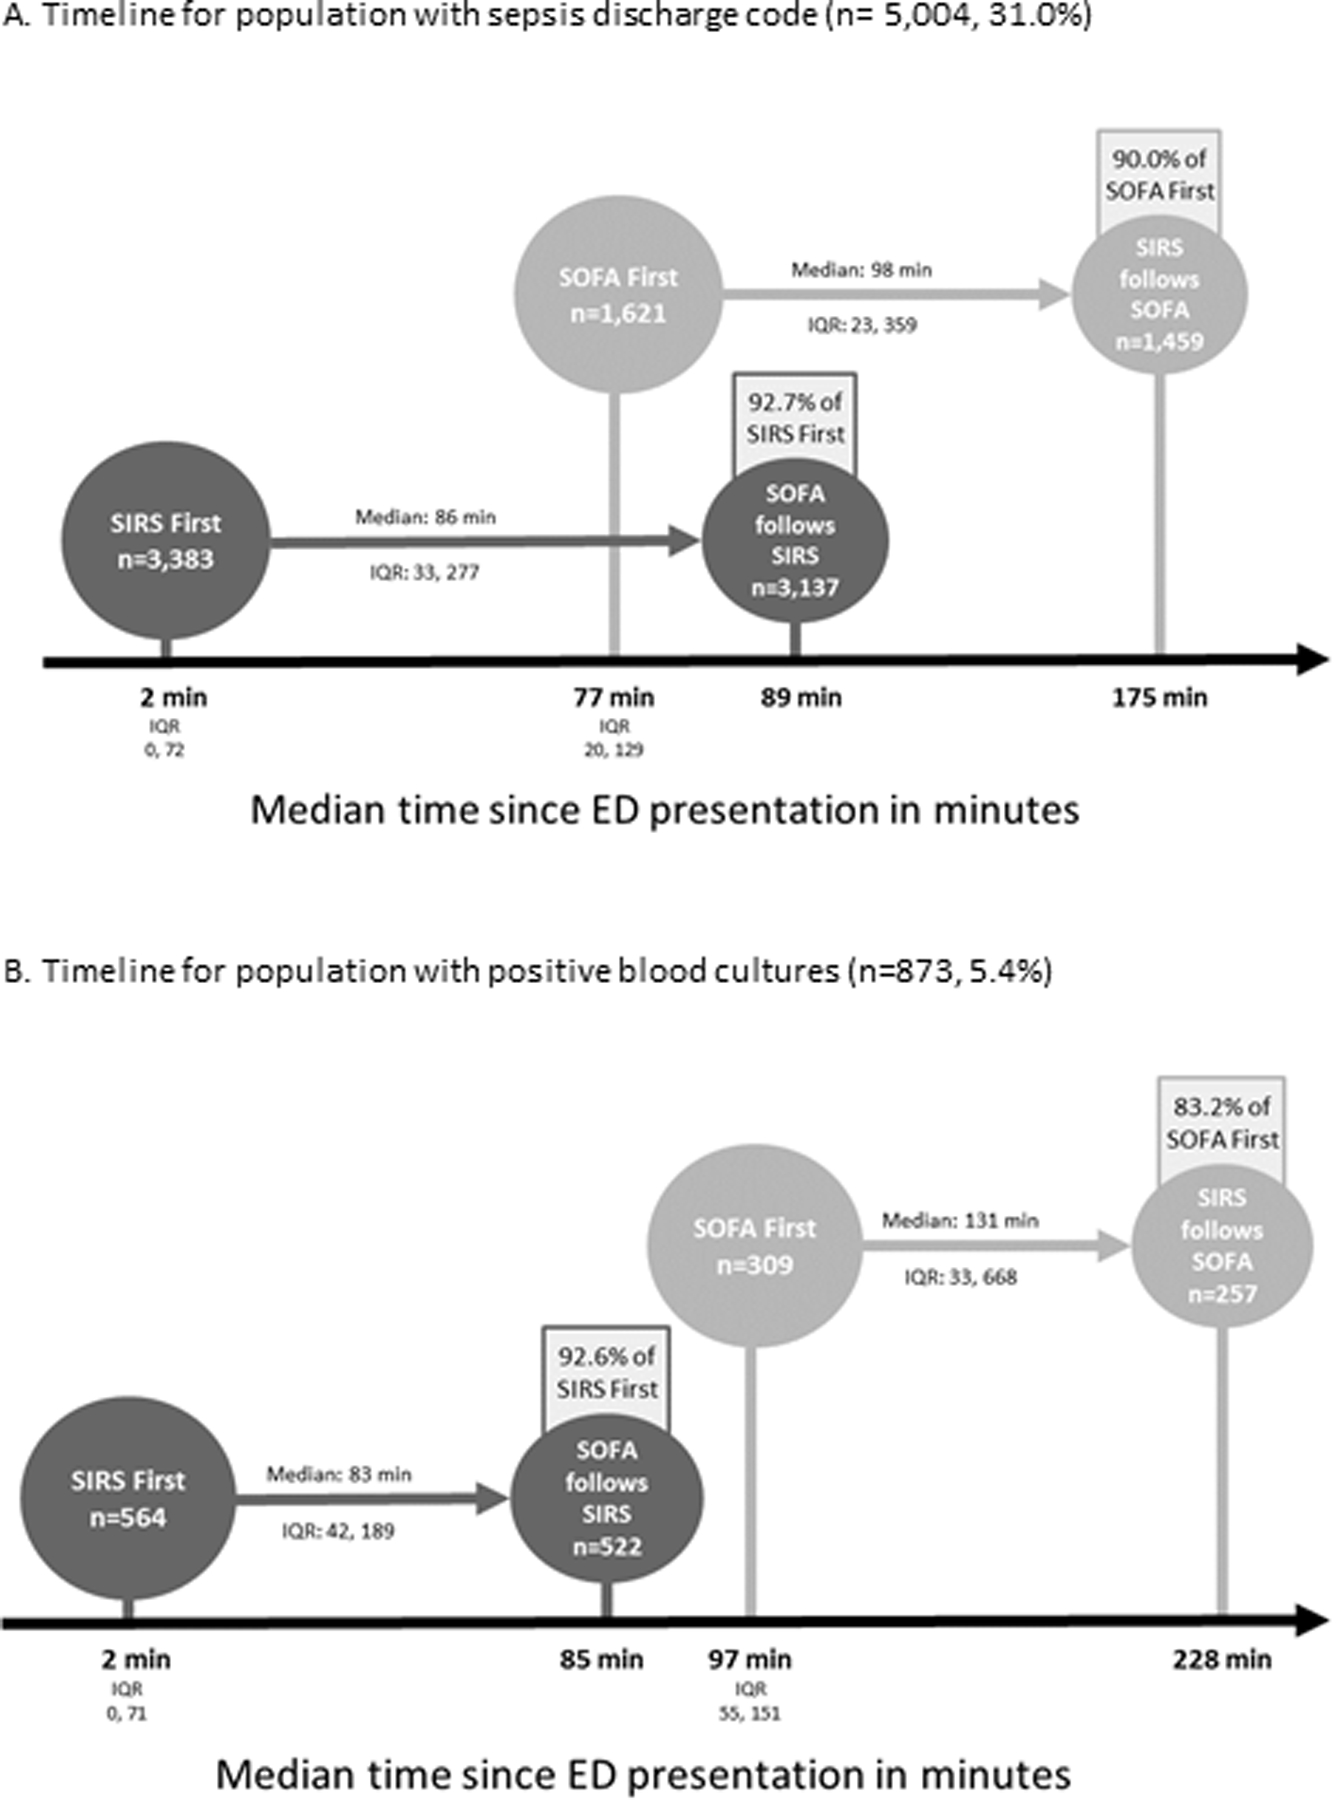
Figure 3. Timeline for meeting SIRS and SOFA among patient subgroups.

In Panel A, the median time to identification of sepsis via SIRS or SOFA is displayed for the 5,004 patients (31.0%) that received a validated sepsis discharge diagnosis code. In Panel B, the median time to identification of sepsis via SIRS or SOFA is displayed for the 873 patients (5.4%) with positive blood cultures. The population is stratified by the first definition met, and when applicable, the median time to meeting the second definition is displayed.
