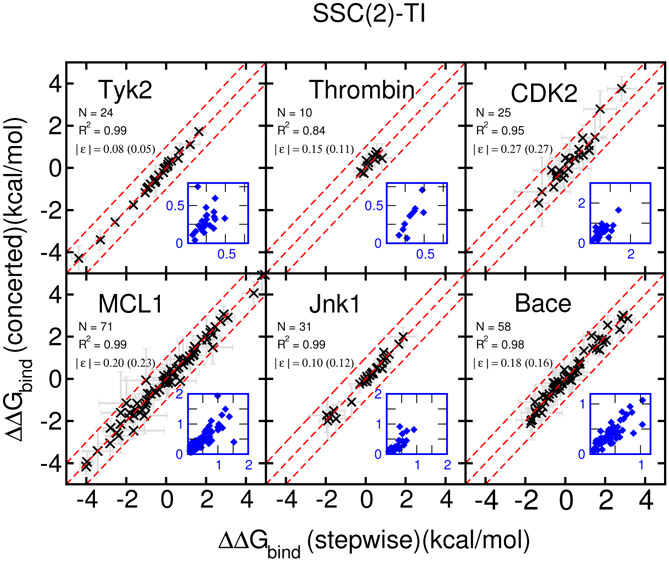
Figure 5:
The results (y-axis) of RBFE for 6 targets of the Wang et al. dataset using the concerted scheme and the SSC(2) smoothstep softcore potential (α=0.2, β=50 Å2) are compared with corresponding values with the stepwise scheme (x-axis). The dashed red lines indicate the region of ±1.0 kcal/mol difference. The corresponding standard deviations are plotted as gray error bars and also shown in the small blue inset plots. The calculated ∣ϵ∣’s are positive definite values and not normally distributed, hence their standard deviations (shown in parentheses) should not be interpretted as indicative of data range.

