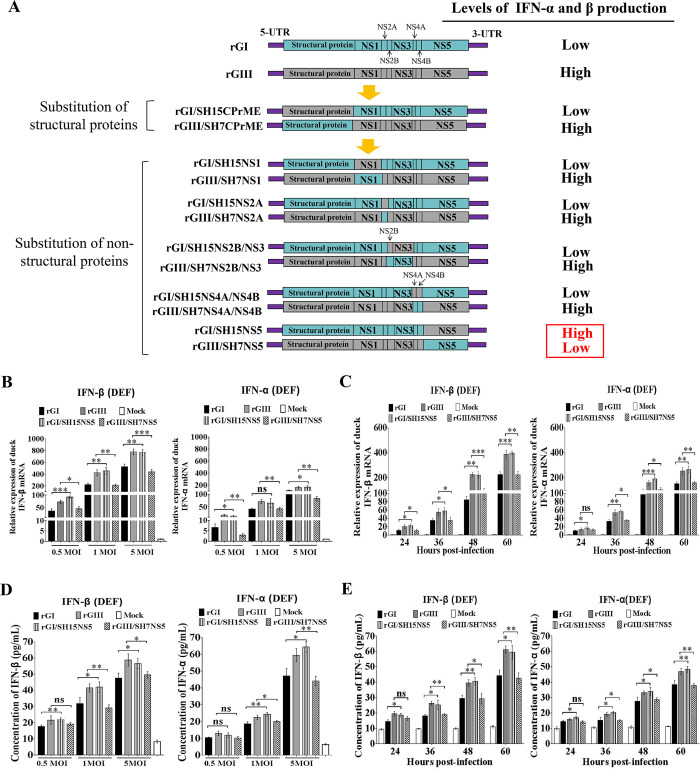
Fig 3. Identification of the viral determinant of different IFN-α and β induction.
(A) Schematic diagram of parental and chimeric recombinant viruses used in this study. Viral proteins of GI and GIII strains are highlighted in blue and gray, respectively. (B and D) DEF were infected with the indicated recombinant viruses at a MOI of 0.5, 1, and 5 and harvested at 24 hpi for measurement of IFN-α and β production. (C and E) DEF were infected with the indicated recombinant viruses at 1 MOI and harvested at the indicated time points for measurement of IFN-α and β production. The mRNA levels of IFN-α and β in the cell pellets were examined by using qRT-PCR (B and C). The concentrations of IFN-α and β proteins in the supernatants were determined with ELISA (D and E). All data are presented as mean ± SD from three independent experiments. ***, p < 0.001; **, p < 0.01; *, p < 0.05; ns, no significant difference, by Student’s t-test.

