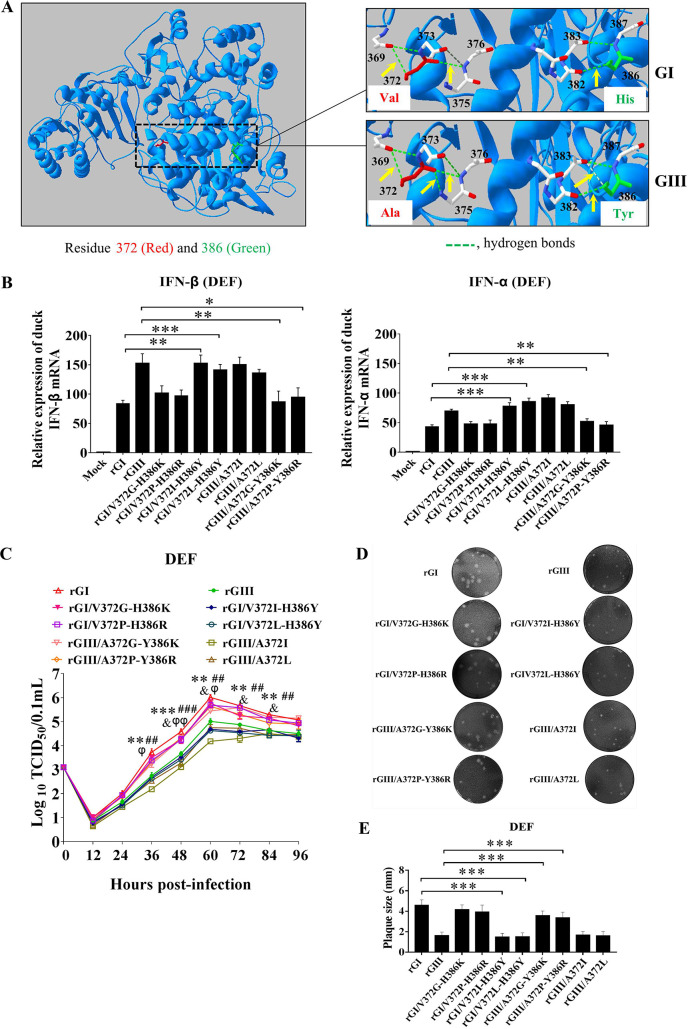
Fig 9. Effects of the number of hydrogen bonds on IFN-α and β expression and viral replication.
(A) 3D structure of NS5. NS5-372 and NS5-386 are highlighted in red and green, respectively. Green broken lines represent hydrogen bonds. The hydrogen bonds formed by NS5-372 and NS5-386 with their neighboring residues are indicated by yellow arrows. (B) DEF were infected with the indicated substitution mutant viruses at 1 MOI and harvested at 24 hpi for measurement of IFN-α and β production at the mRNA level by qRT-PCR. *, p < 0.05; **, p < 0.01; ***, p < 0.001, by Student’s t-test. (C) DEF were infected with the indicated substitution mutant viruses at 0.01 MOI for analysis of replication efficiency. The supernatants were sampled at the indicated time points and titrated with TCID50 assays on BHK cells. Significant difference between rGI and rGI/V372I-H386Y is labeled (***, p < 0.001; **, p < 0.01). Significant difference between rGI and rGI/V372L-H386Y is marked (###, p < 0.001; ##, p < 0.01). Significant difference between rGIII and rGIII/A372G-Y386K is indicated (&, p < 0.05). Significant difference between rGIII and rGIII/A372P-Y386R is indicated (φφ, p < 0.01; φ, p < 0.05). (D and E) Monolayers of DEF were infected with the indicated substitution viruses at 100 PFU for analysis of plaque morphology. The plaques were stained with crystal violet at 4 dpi (D) and the plaque diameters were measured and plotted €. The significant differences between groups were tested by Student’s t-test (***, p < 0.001).

