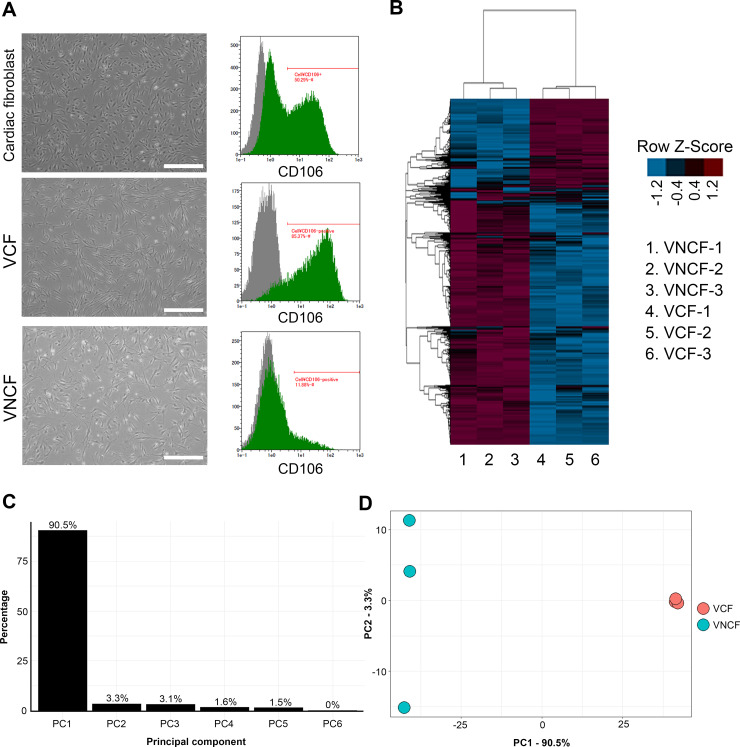
Fig 2. The functional role of differences between VCFs and VNCFs in blood and lymph vessel formation.
A, Micrographs of CFs, VCFs, and VNCFs cultured for five days, and corresponding immunoprofiling for VCAM1. Gray peaks correspond to the expression pattern of isotype control. B, Heatmap of transcriptome showing the specific profiles of VCFs and VNCFs. C–D, Scree plot and PC1-2 plot of genes differentially expressed in VCFs and VNCFs showing a clear clustering of both cell types along PC1.

