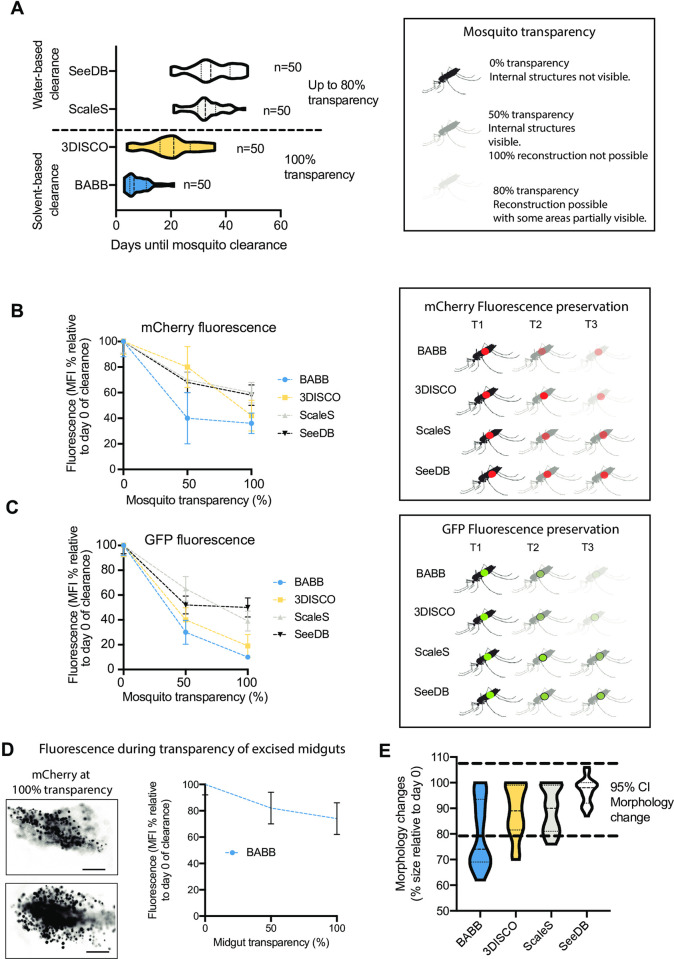
Fig 2. Quantitative and semi-quantitative assessment of tissue clearance methods as applied to A. stephensi mosquitoes.
A) Determination of time of clearance for achievement of transparency of Anopheles mosquitoes. For each method, 50 mosquitoes were embedded in ultrapure low melting temperature agarose gel, and processed as required for SeeDB, ScaleS, 3DISCO and BABB clearance. Mosquitoes were imaged by confocal microscopy, and 100% transparency determined as the possibility to image through the full sample at a high level of detail and without significant light scattering. Two-way ANOVA test between methods for days required for mosquito clearance, p = 0.06. B) mCherry fluorescence intensity and C) GFP fluorescence intensity were measured using a widefield microscope in all infected mosquitoes at the time of euthanasia (at day 12 post-infection) prior to clearance, and this value was defined as 100% for each sample. Fluorescence was measured again at various times of clearance. Graph B shows the average fluorescence percentage relative to time 0, at time points whereby 50% and maximum transparency were achieved. Dots represent average percentage. Error bars represent standard deviations. ANOVA tests resulted in p-values of 0.86 and 0.82 for B and C respectively. D) Mosquito midguts were excised and optically cleared using BABB. mCherry fluorescence intensity was then measured throughout midgut clearance. Images show fluorescence by the time the midgut was fully cleared. Results shown in the graph are the mean and standard deviations of 20 midguts measured. Scale bar: 20 μm. E) Semi-quantitative representation of morphological changes in mosquitoes following incubation in BABB, 3DISCO, SeeDB or ScaleS. Mosquito sizes were measured at point 0 (day of euthanasia), and measured again at the time of maximum transparency. Dotted lines represent the range considered not significant, based on all measures regardless of method used. Only BABB resulted in tissue shrinkage leading to a median size decrease of 26% (SD = 13). Sample size for each method was n = 50 mosquitoes. Two-way ANOVA test between all clearance methods for morphology, p = 0.12. Mosquito diagrams in this figure are republished from BioRender under a CC BY license, with permission from BioRender, original copyright (2020).

