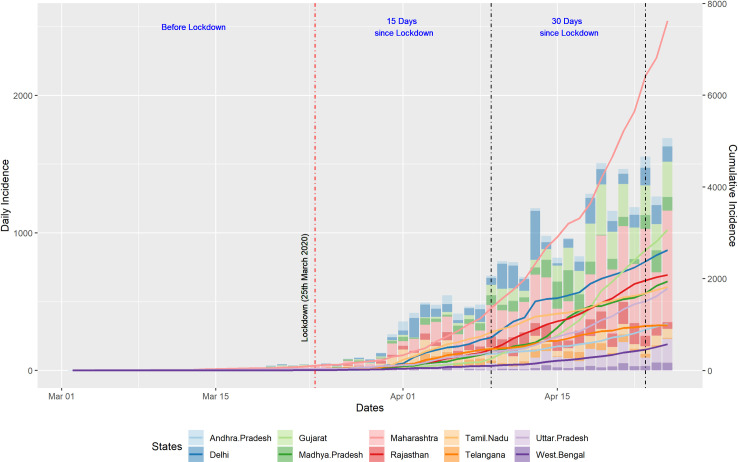
Fig 1. Composite plot of daily and cumulative incidence of COVID-19.
The daily new cases (daily incidence) of the selected states are represented on the primary y-axis as columns. The lines on the secondary y-axis represent the total cumulative cases (cumulative incidence). The three vertical lines on the x-axis represent the three time-points considered for the study. The first vertical line represents the initiation of lockdown; the second vertical line represents the period of 15 days into lockdown, whereas the third vertical line represents 30 days into lockdown.

