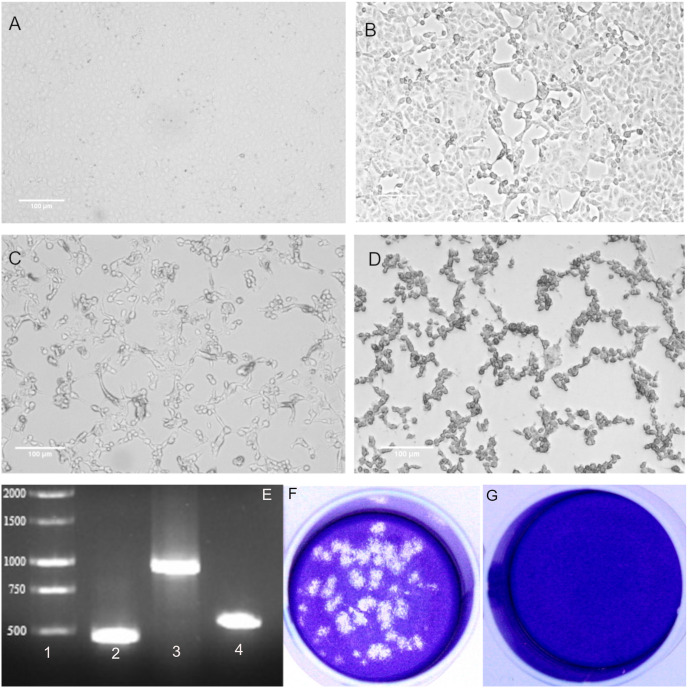
Fig 1. Isolation of hCoV-19/Turkey/ERAGEM-001/2020 in Vero E6 cells from the nasopharyngeal sample of a patient with COVID-19 in Turkey in 2020.
Phase contrast microscopy (Leica, DMi1) of culture containing (A) mock-infected Vero E6 cells, (B) Vero E6 cells at 24 h post-infection, (C) Vero E6 cells at 48 h post-infection (D), and Vero E6 cells at 72 h post-infection. Scale bars = 100 μm. (E) RT-PCR amplification of viral RNA from Vero E6 cells infected with hCoV-19/Turkey/ERAGEM-001/2020 (1% gel). (1) Molecular weight marker 1 kb (MW). Target amplicons: (2) SARS-CoV-2 NP1 amplified with 2019-nCoV_N1 forward and 2019-nCoV_N3 reverse primers, 469 bp. (3) SARS-CoV-2 NP2 amplified with 2019-nCoV_N1 forward and 2019-nCoV_N2 reverse primers, 945 bp, and (4) SARS-CoV-2 NP3 amplified with2019-nCoV_N3 forward 2019-nCoV and 2019-nCoV N2 reverse primers, 549 bp, 1% gel. Plaque morphology for SARS-CoV-2 on Vero E6 cells at 72 h post-infection. (F) SARS-CoV-2 stock was plaqued on Vero E6 cells and visualized by crystal violet staining. (G) An uninfected control; the dilution factor of SARS-CoV-2 used for infection was a 10−4.

