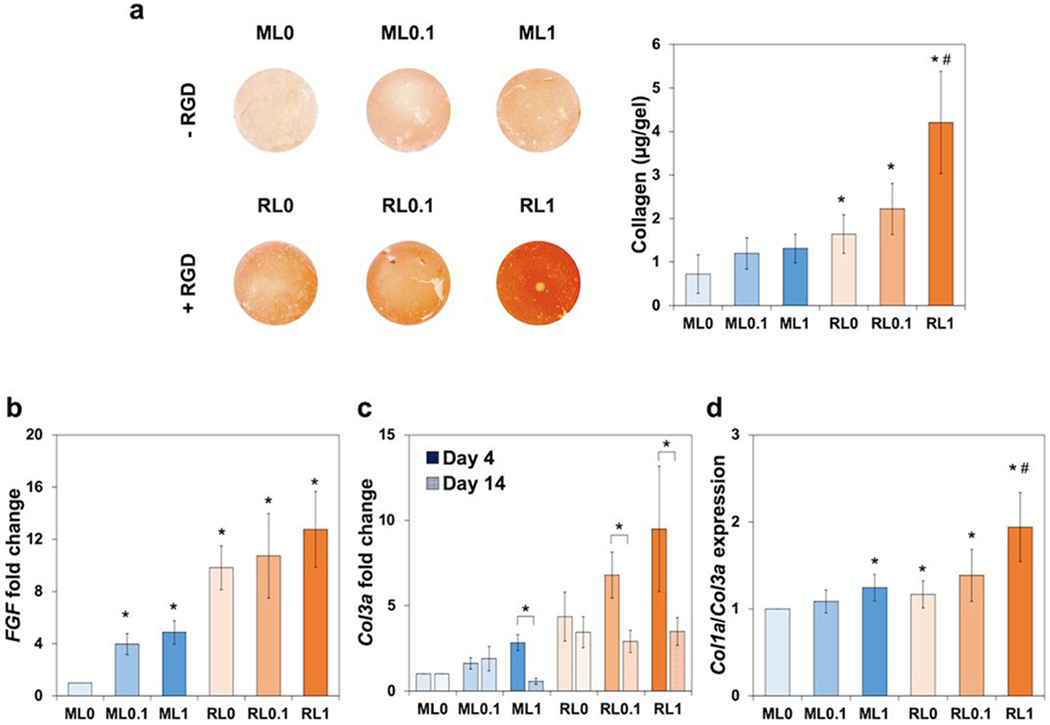
Figure 4.
In vitro extracellular matrix deposition in hydrogels with the encapsulation of NIH/3T3s over two weeks. (a) Picrosirius staining images representing total collagen deposition in hydrogels and quantified collagen amount at day 14. Gene expression related with fibroblasts, (b) FGF at day 4, (c) Col3a at day 4 and 14, and (d) The ratio of Col1a to Col3a at day 14. *p < 0.01 compared to ML0. #p < 0.01 compared to other groups (ML0, ML0.1, ML1, RL1, and RL0.1).

