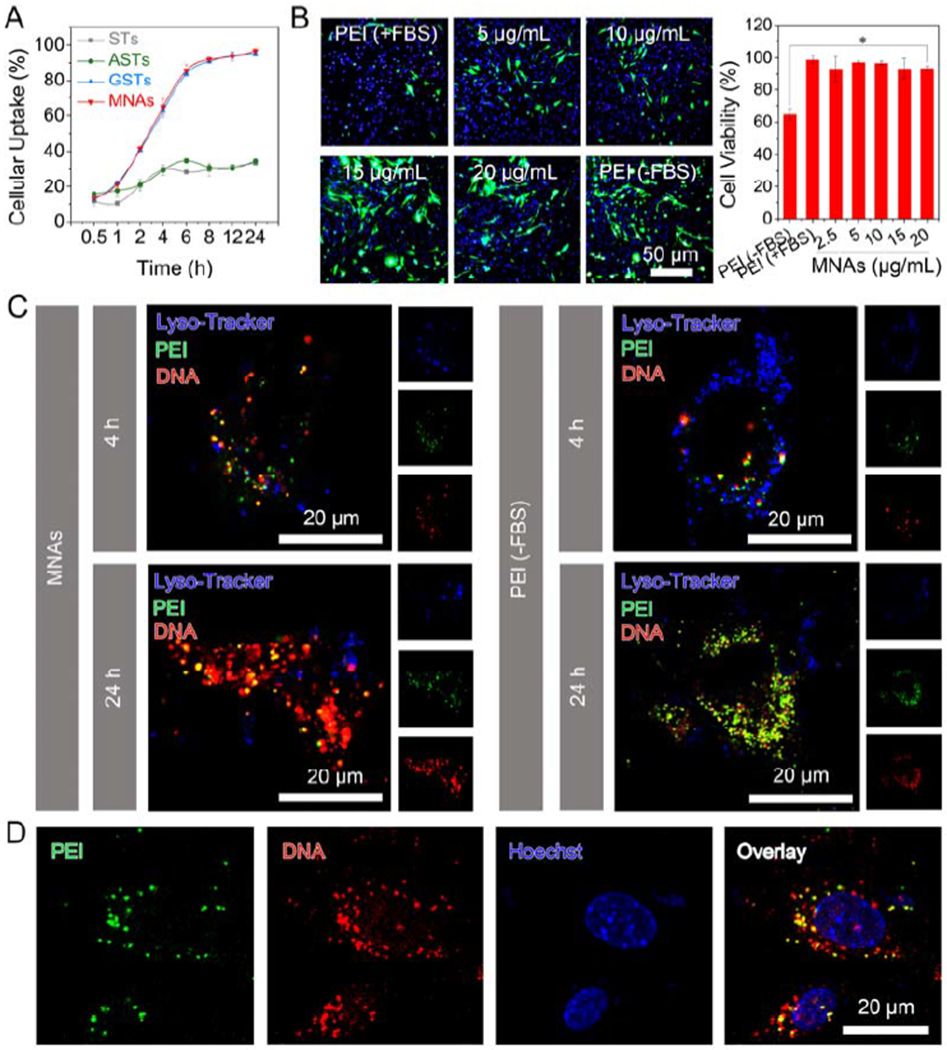
Figure 2.

2D cell culture of BMSCs for investigating intracellular fate and gene expression efficiency of MNAs. (A) Cellular uptake efficiency of 15 μg/mL STs, ASTs, GSTs and MNAs over 24 h (means ± SD, n = 3). (B) GFP expression (left) in BMSCs after exposure to MNAs with various concentrations, pDNA/PEI complex without (−) FBS or with (+) FBS for 48 h including GFP channel (green), Hoechst-stained nucleus channel (blue) and overlay of previous images. Cell viability was detected by alarmerBlue assay (means ± SD, n = 6). (C) CLSM images for BMSCs after incubation with 15 μg/mL MNAs (left) and pDNA/PEI complex (right), including FITC-labeled PEI channel (green), Cy5-labeled pDNA channel (red), Lysotracker-stained lysosome channel (blue) and overlay of previous images. (D) CLSM images for BMSCs after incubation with 15 μg/mL MNAs for 24 h, including FITC-labeled PEI channel (green), Cy5-labeled pDNA channel (red), Hoechst-stained nucleus channel (blue) and overlay of previous images.
