
Figure 7.
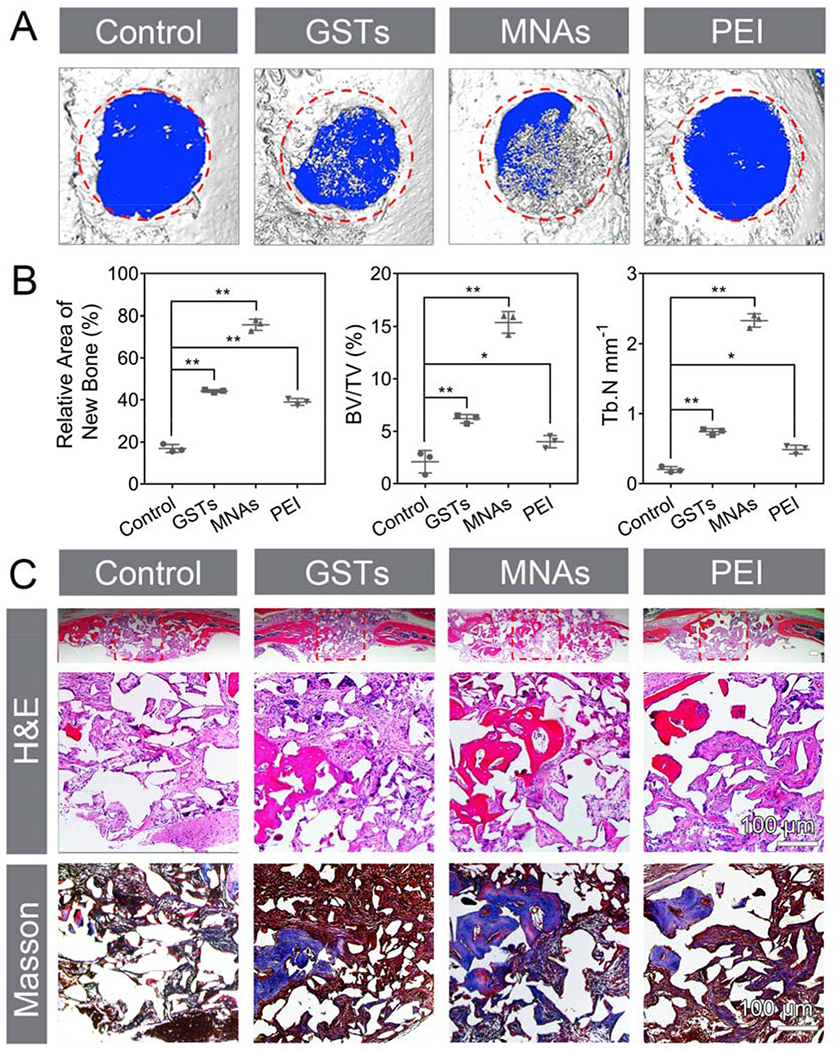
In vivo evaluation of osteoinduction using calvarial defect model. (A) 3D μ-CT images of calvarial defects. The red area with 3 mm diameter indicates the defect site. (B) Semiquantitative analysis of relative new bone, BV/TV and Tb.N (means ± SD, n = 3, *p < 0.05, **p < 0.001 by one-way analysis of variance, ANOVA). (C) H&E staining, magnified images of H&E and Masson trichrome staining. Red boxes represent the magnified areas. Scar bar repents 100 μm.