Figure 1.
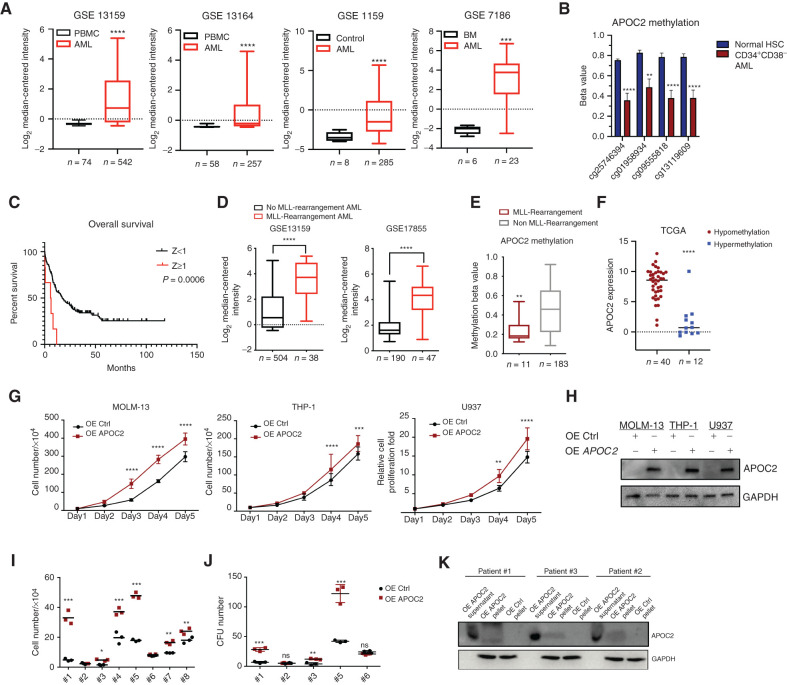
APOC2 is upregulated in AML and associated with poor clinical outcomes and promotes leukemia growth in vitro. A, The relative expression of APOC2 in: 542 AML cases compared with 74 healthy donors in the GSE13159 dataset; 257 AML cases compared with 58 healthy donors in the GSE13164 dataset; 285 AML cases compared with eight healthy donors in the GSE1159 dataset; and 23 AML cases compared with six healthy donors in the GSE7186 dataset (compared by Mann–Whitney tests). B, Comparisons of APOC2 methylation beta values between normal HSC and CD34+CD38−cells (LSCs) from patients with AML (unpaired t tests). C, Patients in TCGA dataset dichotomized into high (Z ≥ 1) or low (Z < 1) groups according to their APOC2 mRNA expression Z-score (RNA Seq V2 RSEM). Patients with high APOC2 levels had significantly shorter OS than patients with low APOC2 expression (median OS 6 vs. 17.4 months, P = 0.0006). D, The relative expression of APOC2 comparison between patients with and without MLL-rearrangements from GSE13159 and GSE17855 (compared by Mann–Whitney tests). E, APOC2 methylation beta value comparison between patients with and without MLL–rearrangements (unpaired t-test, P = 0.0035). F, Expression of APOC2 in AML patients with APOC2 hypomethylation (β ≤ 0.2) and hypermethylation (β ≥ 0.8). G, Cell proliferation assays in MOLM-13, THP-1, and U937 cells transduced with control or APOC2 overexpression lentiviral particles (compared by two-way ANOVA). H, Western blot analysis of APOC2 overexpression in AML cell lines. I, Viability assays for the growth of AML patient primary blasts transduced with either APOC2 or control lentiviral particles (compared by unpaired t tests). J, Colony formation unit (CFU) assays in AML patient primary blasts transduced with either APOC2 or a control vector (compared by unpaired t tests). K, Western blot analysis of APOC2 overexpression in primary patient samples showing APOC2 bands in the supernatant and cell pellet of blasts transduced with APOC2 lentiviral particles compared with control transduced blasts. (****, P < 0.0001; ***, P < 0.001; **, P < 0.01; *, P < 0.05; ns, not significant).

