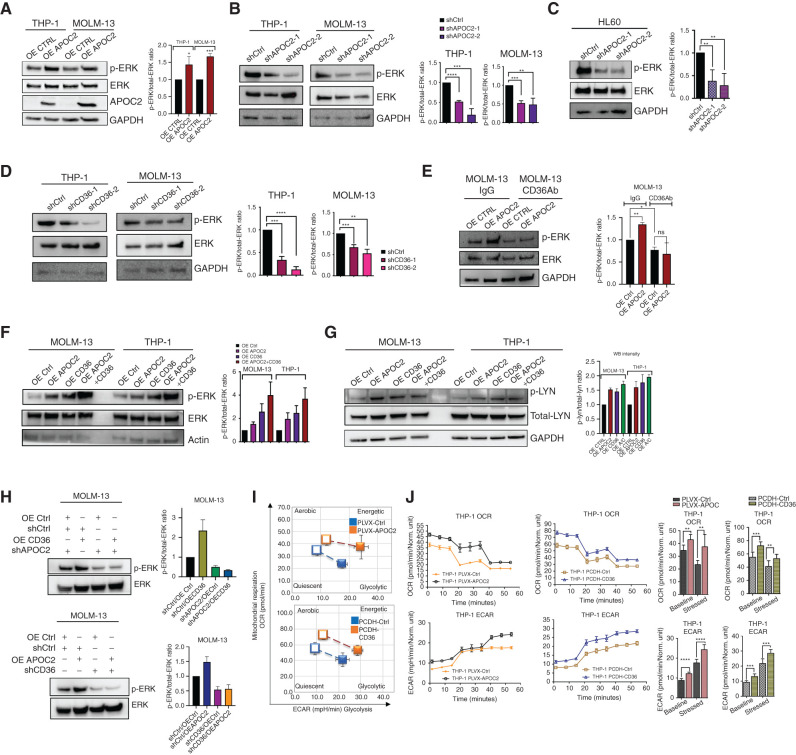
Figure 5.
APOC2–CD36 activates the ERK signaling pathway and enhances metabolic activity of leukemic cells. A, The levels of p-ERK and total-ERK proteins detected by Western blot in THP-1 and MOLM-13 cells ectopically expressing APOC2 compared with empty vector control cells. GAPDH was used as an internal control (quantification of three independent repeats). B, The levels of p-ERK and total-ERK proteins detected by Western blot in THP-1 and MOLM-13 APOC2 knockdown and scramble control cells. GAPDH was used as an internal control (quantification of three independent repeats). C, Thelevels of p-ERK and total-ERK proteins detected by Western blot in HL60 APOC2 knockdown and scramble control cells. Right, the p-ERK/total-ERK ratio in the control and knockdown APOC2 cells (quantification of four independent repeats). D, The levels of p-ERK and total-ERK proteins detected by Western blot in THP-1 and MOLM-13 CD36 knockdown and scramble control cells. GAPDH was used as an internal control (quantification of three independent repeats). E, The levels of p-ERK and total-ERK proteins detected by Western blot in MOLM-13 OE Ctrl and OE APOC2 cells treated with IgG or CD36Ab. GAPDH was used as an internal control (quantification of two independent repeats). F, The levels of p-ERK and total-ERK proteins detected by Western blot in THP-1 and MOLM-13 OE Ctrl, OE APOC2, OE CD36, and OE APOC2+CD36 cells. Actin was used as an internal control (quantification of two independent repeats). G, The levels of p-LYN and total-LYN proteins detected by Western blot in MOLM-13 and THP-1 OE Ctrl, OE APOC2, OE CD36, and OE APOC2+CD36 cells. GAPDH was used as an internal control (quantification of two independent repeats). H, The levels of p-ERK and total-ERK proteins detected by Western blot in CD36 OE MOLM-13 cells transduced with shAPOC2 tet-on viral particles and in APOC2 OE cells transduced with shCD36 tet-on viral particles (quantification of two independent repeats). I, Cell energy phenotype of PLVX-Ctrl, PLVX-APOC2 and PCDH- Ctrl, and PCDH- CD36 THP-1 cells. Baseline phenotype is indicated by an open marker. Stressed phenotype is indicated by a filled marker. J and K, OCR (to quantify mitochondrial respiration) and ECAR (indicator of glycolysis) of PLVX-Ctrl, PLVX-APOC2 and PCDH- Ctrl and PCDH- CD36 THP-1 cells determined by Seahorse XF cell analysis. The differences between the groups were analyzed using unpaired t tests and one-way ANOVA (****, P < 0.0001; ***, P < 0.001; **, P < 0.01; *, P < 0.05; ns, not significant).

