
Fig. 5.
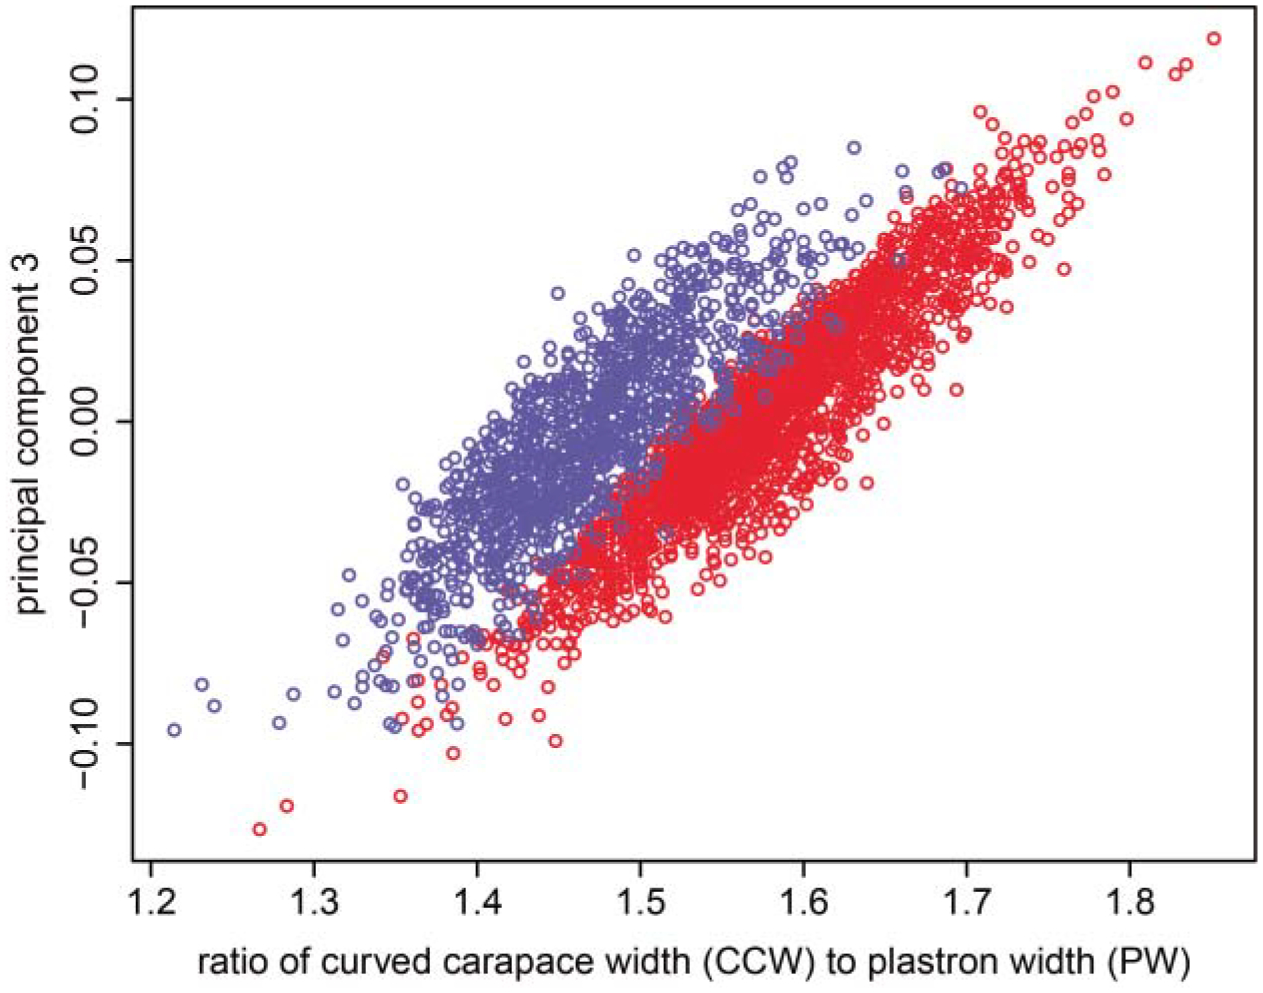
As seen by its relationship to the ratio of curved carapace width to plastron width (CCW/PW; r = 0.78, P < 0.001), PC3 represents a measure of relative shell curvature. Only females (red dots) achieve the highest shell curvature and lowest PC3 values.